...
Hash Table Performance
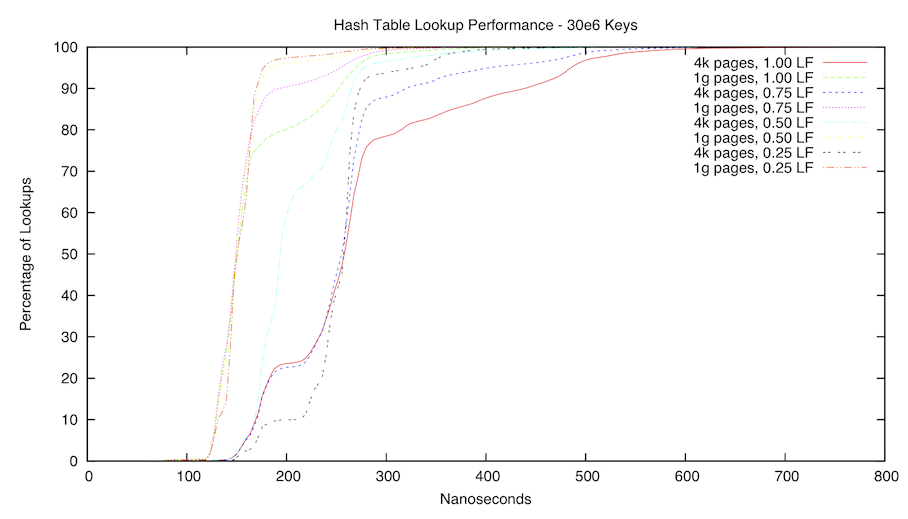
The following first graph is a CDF of our hash table. We benchmarked on an AMD Phenom Q9850, with a measured main memory latency of 132 nanoseconds. We tested with both 4k and 1g pages, the latter in order to avoid TLB misses and walks. Note that all 1g page experiments were better than all 4k experiments, regardless of load factor. Also note that the 1g experiment does not avoid all TLB misses, as the objects themselves are malloced and located in 4k space, so a TLB miss is expected on each key verification. This limitation is simply due to constricted memory on the test machine.
The PDF is available here: hashtable_phenom.pdf
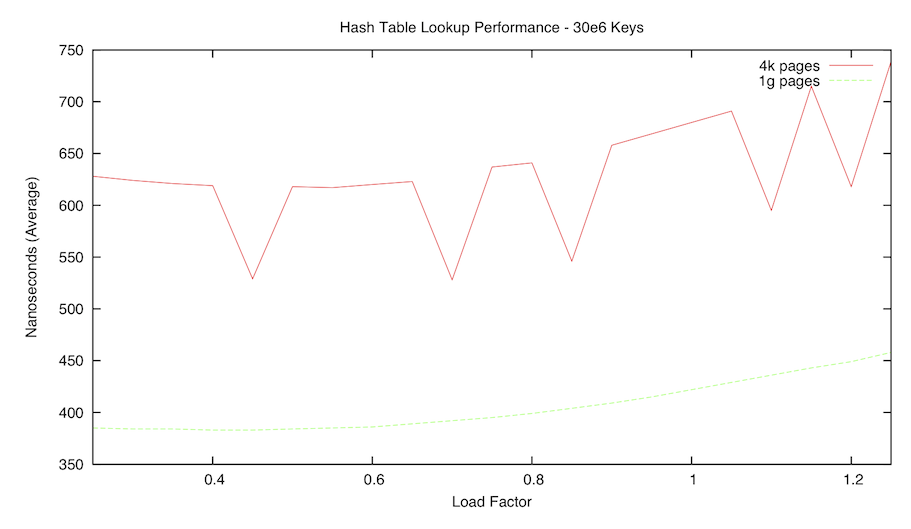
The following is a graph second graph is a comparison of average lookup performance with varying load factors. As in the above, we used 30e6 keys. The load factor was varied from 0.25 to 1.25 in 0.05 increments.
XXX- What's up with the sawtooth pattern?
The PDF is available here: hashtable_phenom_avg.pdf
Another with times with our hash table using 12e6 keys. The load factor was varied from 0.10 to 2.00 in 0.01 increments.
The PDF is available here:
hashtable_phenom_avg_lots.pdf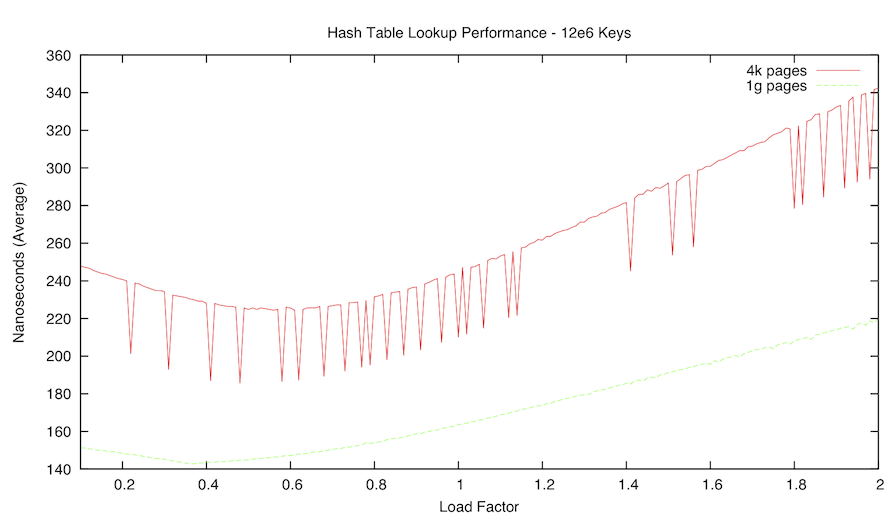
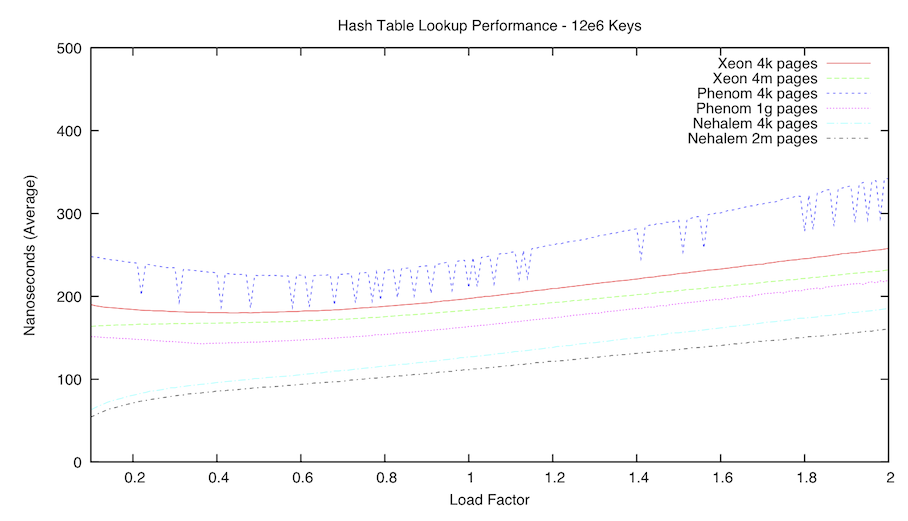
avg_comparison.pdf