...
| View file | ||||
|---|---|---|---|---|
|
After fixing timetracing in DpdkDriver in commit `c16fa4c`, it became clear that the ~15us latency at 99% was not due to network queueing delay. In addition, it looks more like kernel jitter because large gap in the time trace on the server side cannot be pinpointed to a fixed location.
| View file | ||||
|---|---|---|---|---|
|
It appears that the kernel compile-time option `CONFIG_NO_HZ_FULL`, which is essential for full-dynticks mode, is not set by default on Ubuntu 15.04 & 16.04. This can be checked by `grep NO_HZ /boot/config*`. Therefore, to turn off the timer interrupts, use Ubuntu 14.04 or compile your own kernel.
...
| View file | ||||
|---|---|---|---|---|
|
It seems like the ~15us (or 30000 cycles) jitters are not due to SMI (Service Management Interrupt) that are invisible to the kernel. This can be verified by running the `user_loop` test program with `THRESHOLD_CYCLES` defined to 100000 and reading msr 0x34 before and after the test program. Here is a sample output:
| View file | ||||
|---|---|---|---|---|
|
The number of jitters printed matches the delta of the two msr 0x34 readings.
...
| View file | ||||
|---|---|---|---|---|
|
It doesn't look very useful as it only records the maximum jitter observed (this behavior can be verified at http://lxr.free-electrons.com/ident?v=4.9;i=get_sample).
...
[2] "Configuring and tuning HPE ProLiant Servers for low-latency applications": https://www.hpe.com/h20195/v2/GetPDF.aspx/c05281307.pdf
[3] https://downloads.linux.hpe.com/SDR/project/stk/
...
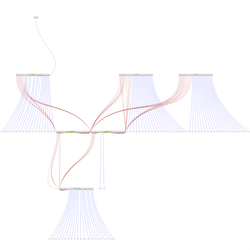
The cluster diagram at Cluster Intro is out of date. I created a new one using https://github.com/glaville/graphviz-infiniband-topology. It's kind of ugly but does the work for me.
An excellent explanation of how the NIC and its driver work collaboratively to send/receive packets: http://stackoverflow.com/questions/36625892/descriptor-concept-in-nic. The DPDK performance optimization guidelines (https://software.intel.com/en-us/articles/dpdk-performance-optimization-guidelines-white-paper) mention a bit more on DPDK-specific config options like `RX_PTHRESH`, `RX_WTHRESH`, etc.
...
| View file | ||||
|---|---|---|---|---|
|
It appears that clock MONOTONIC_RAW 1) gives the most consistent result across the cluster as well as multiple runs and 2) is the only one whose result matches the 1995.379 MHz computed by kernel. However, does it suggest clock MONOTONIC_RAW gives the most accurate estimate? I don't know yet.
...
After calibrating the TSC clocks on different machines and merging the time traces, it's easy to compute the one-way propagation delay of each packet. If you order the delays of all the outbound DATA/ALL_DATA packets from one client by their TX times, it becomes clear that when there are already several ongoing messages and another 0.5MB message starts, the delay number tends to increase visibly. The delay number becomes more or less stable again at least after all the unscheduled packets of that long message are transmitted. Finally, the number decreases after a long message finishes. This is suggesting that a transient queue is being built up in the sender's NIC. It turns out that there is a unsigned integer underflow in QueueEstimator::getQueueSize(uint64_t) when the caller passes in a stale time that is less than QueueEstimator::currentTime and, as a result, getQueueSize incorrectly returns 0 as the estimated queue size. Therefore, in the worst case, the transport could enqueue two more full packets even though there are already two in the NIC's TX queue. But how can the caller passes in a stale time value in the first place? Well, one example would be that, in HomaTransport::tryToTransmitData(), we are using the stale time value stored in Dispatch::currentTime to save the cost of one RDTSC instruction. After fixing this bug, we don't see the delay number go up significantly and remain high for a long period like before.
Why does it take so long for a master to start sending out the reply of an EchoRpc that fits in one ALL_DATA packet? Firstly, it appears that inserting a `serverRpc` into the unordered_map `incomingRpcs` is really expensive: it can easily take more than 250ns! Also, after calling "context->workerManager→handleRpc(serverRpc);" in HomaTransport, it takes > 100ns before the RPC can be dispatched by the MasterService.
| View file | ||||
|---|---|---|---|---|
|

