...
Processor | MHz | Architecture | Page Size | Ticks/Access | NSec/access |
|---|---|---|---|---|---|
Phenom 9850 Quad-Core | 2500 | K10 | 4k | 529 491 | 212 196 |
Phenom 9850 Quad-Core | 2500 | K10 | 1g | 244 260 | 98 104 |
Xeon Dual-Core 3060 | 2400 | Core 2 | 4k | 262 357 | 109 149 |
Xeon Dual-Core 3060 | 2400 | Core 2 | 4m | 193 241 | 80 100 |
Core i7-920 | 2667 | Nehalem | 4k | 99 381 | 37 143 |
Core i7-920 | 2667 | Nehalem | 2m | 63 213 | 24 80 |
- Determined in userspace by the following:
Code Block const size_t maxmem = 1 * 1024 * 1024 * 1024; int main() { uint32_t *buf = getbuf(); const int loops = 100 * 1000 * 1000; uint64_t b; uint64_t blah = 0; // don't compile away int i; b = rdtsc(); *buf = getbuf(); uint64_t b, i, j, total; memset(buf, 0, maxmem); size_t maxidx = maxmem / sizeof(buf[0]); //randomly link our pointers for (i = 0; i < loopsmaxidx; i++) blah + { int idx = random() % (maxmem / sizeof(buf[0])); uint64_t random_ticks = rdtsc() - b; printf("%" PRIu64 " ticks for random-mod (%" PRIu64 " each)\n", random_ticks, random_ticks / loops); maxidx; buf[i] = (uint64_t)&buf[idx]; } total = 0; for (j = 0; j < 100; j++) { uint64_t *p = &buf[random() % maxidx]; b = rdtsc(); for (i = 0; i < loops; i++) blah += buf[random() % (maxmem / sizeof(buf[0]))]; uint64_t access_ticks { if (*p & 0x1) break; uint64_t *next = (uint64_t *)*p; *p |= 0x1; p = next; } uint64_t diff = rdtsc() - b; printf(" if (i == 0) break; printf("walk %" PRIu64 " did %" PRIu64 " totalaccesses ticksin (%" PRIu64 " average each)ticks\n", j, access_ticks, access_ticks / loops); printf("%" PRIu64 " ticks not including random-mod (i, (diff / i)); total += (diff / i); //clean up & wreck the cache for (i = 0; i < maxidx; i++) buf[i] &= ~0x1; } printf("average of all walks: %" PRIu64 " each)ticks\n", total / j); access_ticks - random_ticks, (access_ticks - random_ticks) / loops); return blah0; }
- Where getbuf() returns a 1GB region of va (maxmem = 1 * 1024 * 1024 * 1024)based on maxmem.
- Note that Phenom and Nehalem have about 23MB of L1 and L2 data TLB coverage. The Xeon is likely similar, if less.
- All chips have < 10MB cache, so > 99% of the data set is uncached.
...
Hash Table Implementation
Our hash table assumes a 64-byte cache line size (which is currently appropriate for most machines and easily modified). The table is comprised of N cache lines and is indexed by cache line number. Each cache line contains eight 8-byte buckets. On insert, we hash to a cache line, and scan the entries linearly until an open one is found. If none are, we use the last entry as a chaining pointer and allocate another cache line. We keep on chaining in this way.
...
Scanning a cache line is an incredibly cheap operation (especially compared with a cache miss), so we stick to the stupid linear scan method. We have tried using SSE prefetch instructions for linked entries, but have found them not to be helpful (the scan is too fast, so prefetching buys little). It may be worth investigating cache-pollution avoidance by accessing the hash table with streaming instructions..h3
Hash Table Performance
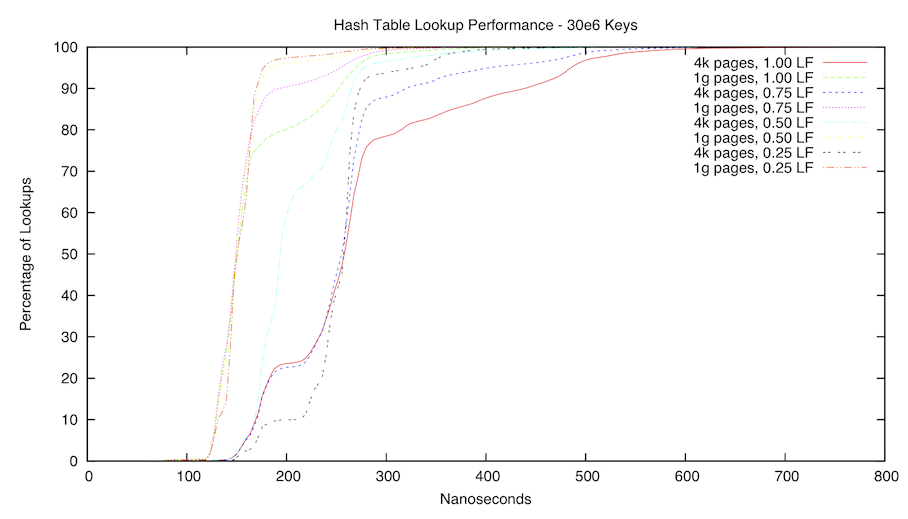
The following first graph is a CDF of our hash table. We benchmarked on an AMD Phenom Q9850, with a measured main memory latency of 132 nanoseconds. We tested with both 4k and 1g pages, the latter in order to avoid TLB misses and walks. Note that all 1g page experiments were better than all 4k experiments, regardless of load factor. Also note that the 1g experiment does not avoid all TLB misses, as the objects themselves are malloced and located in 4k space, so a TLB miss is expected on each key verification. This limitation is simply due to constricted memory on the test machine.
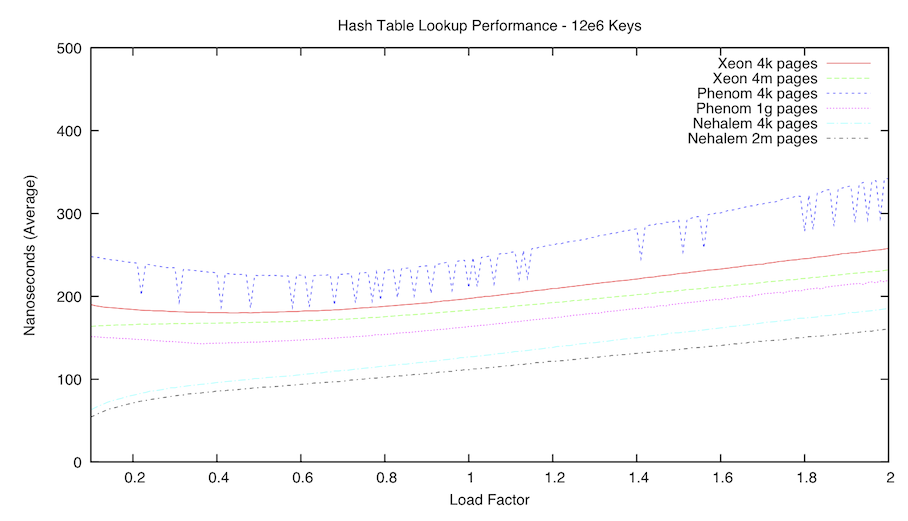
The second graph is a comparison of average lookup times with our hash table using 12e6 keys. The load factor was varied from 0.10 to 2.00 in 0.01 increments.