...
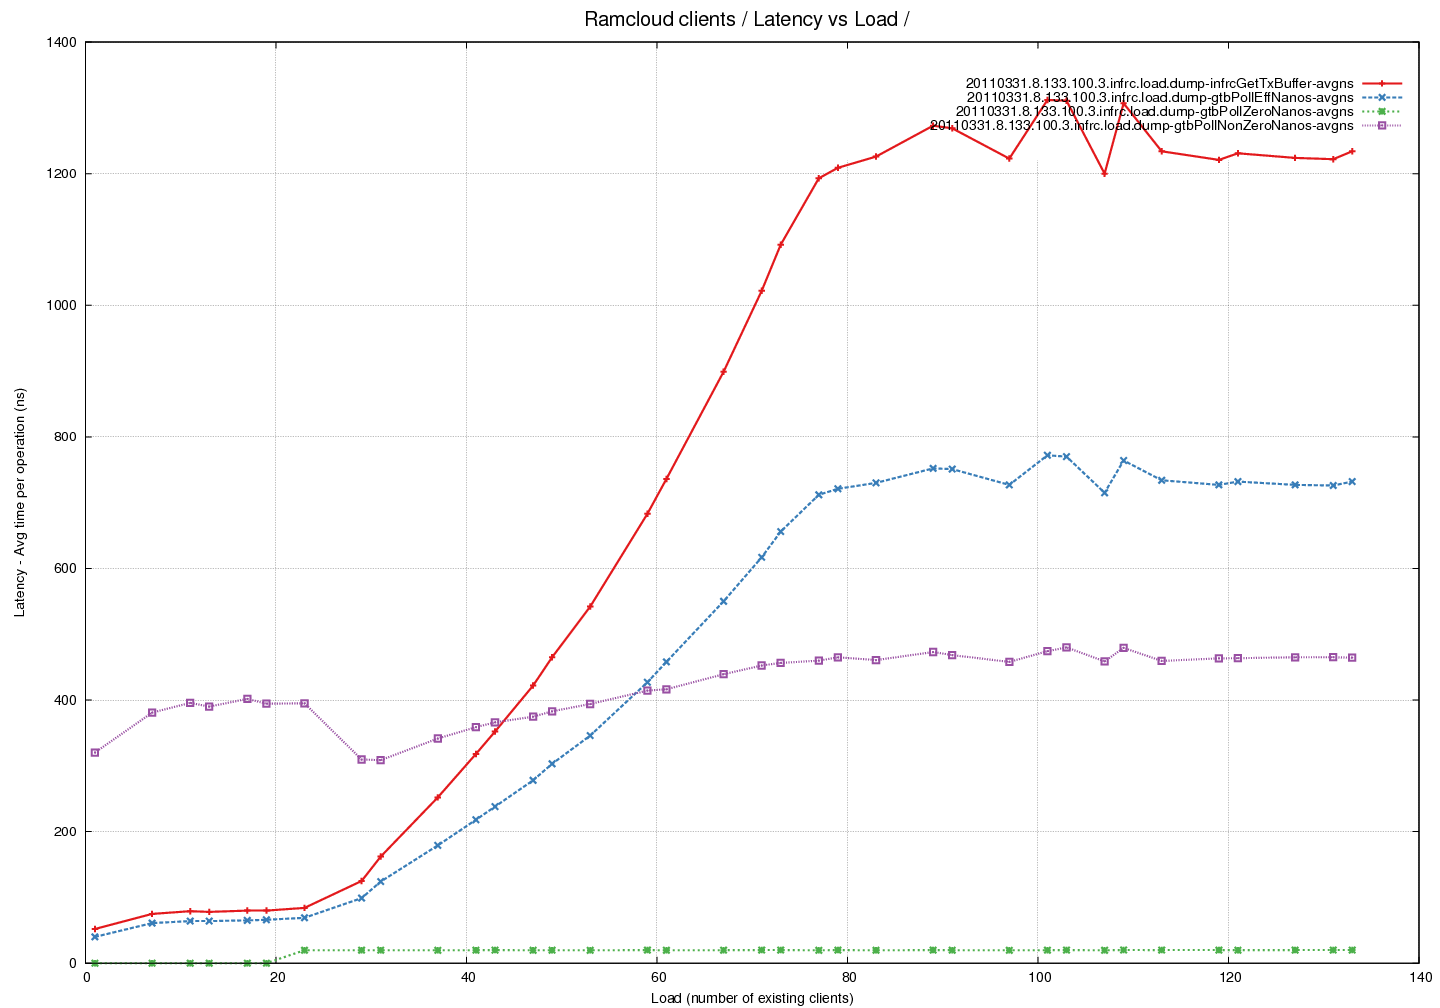
Latency Graph - Time spent in pollCQ per read (average) - fixed pool of buffers - comparing time taken by successful calls against calls that return 0
- Note that time taken per unsuccessful callsuccessful call is increasing with load. Number of calls also increases with load => multiplicative effect.
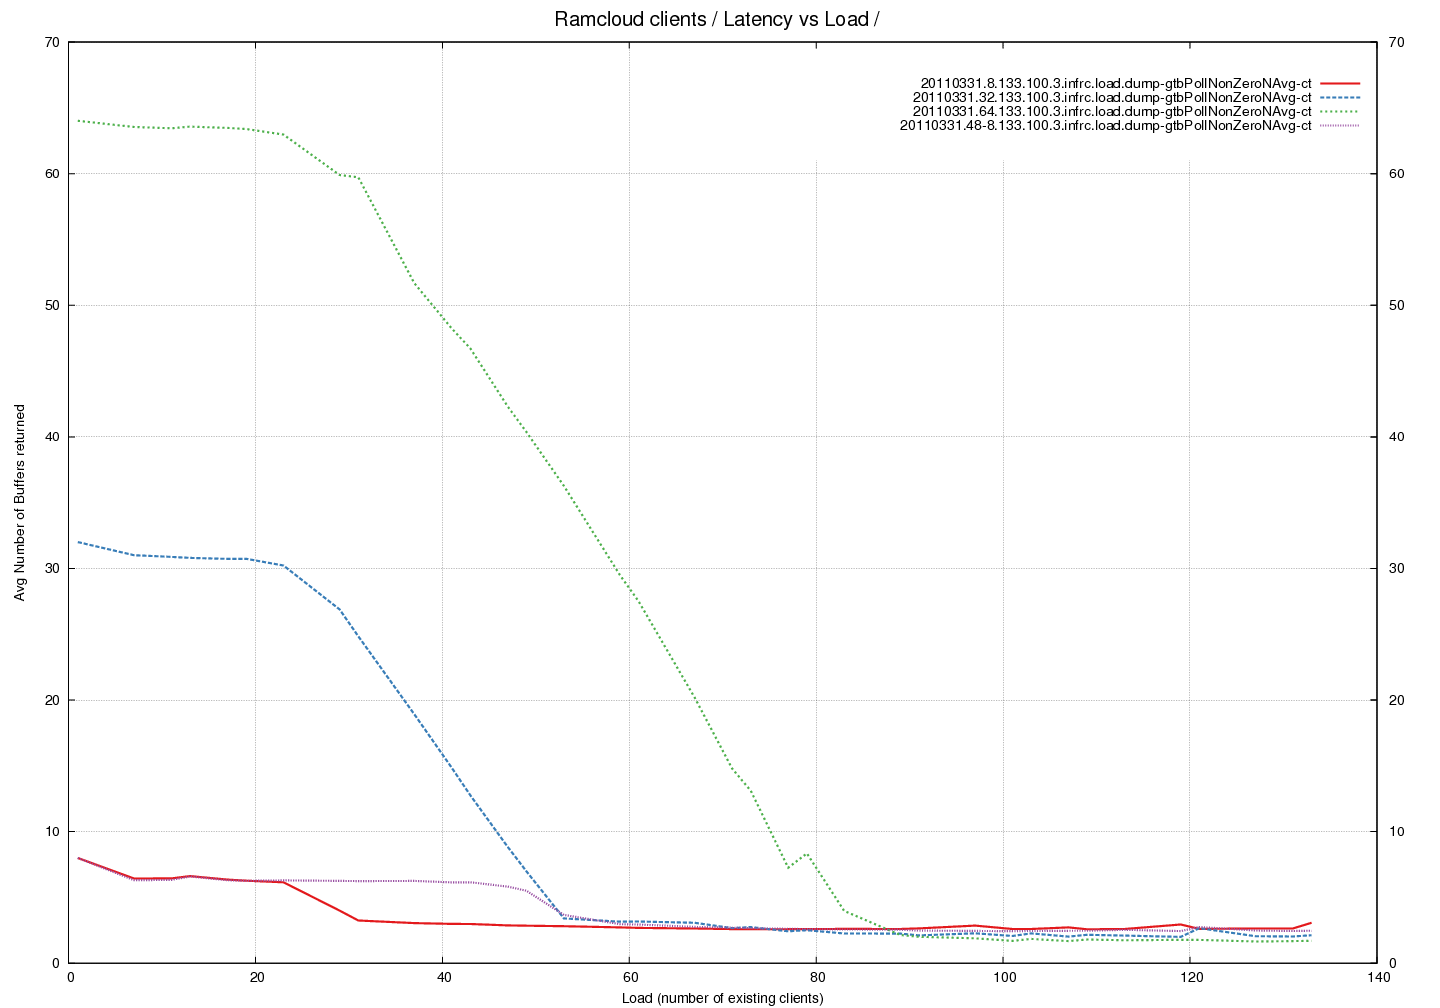
Latency Graph - Average number of buffers returned by pollCQ across different Buffer Pool sizes
- An interesting trend here that is independent of number of buffers in the pool. There is a drop in the average at the same load irrespective of buffer-pool.