...
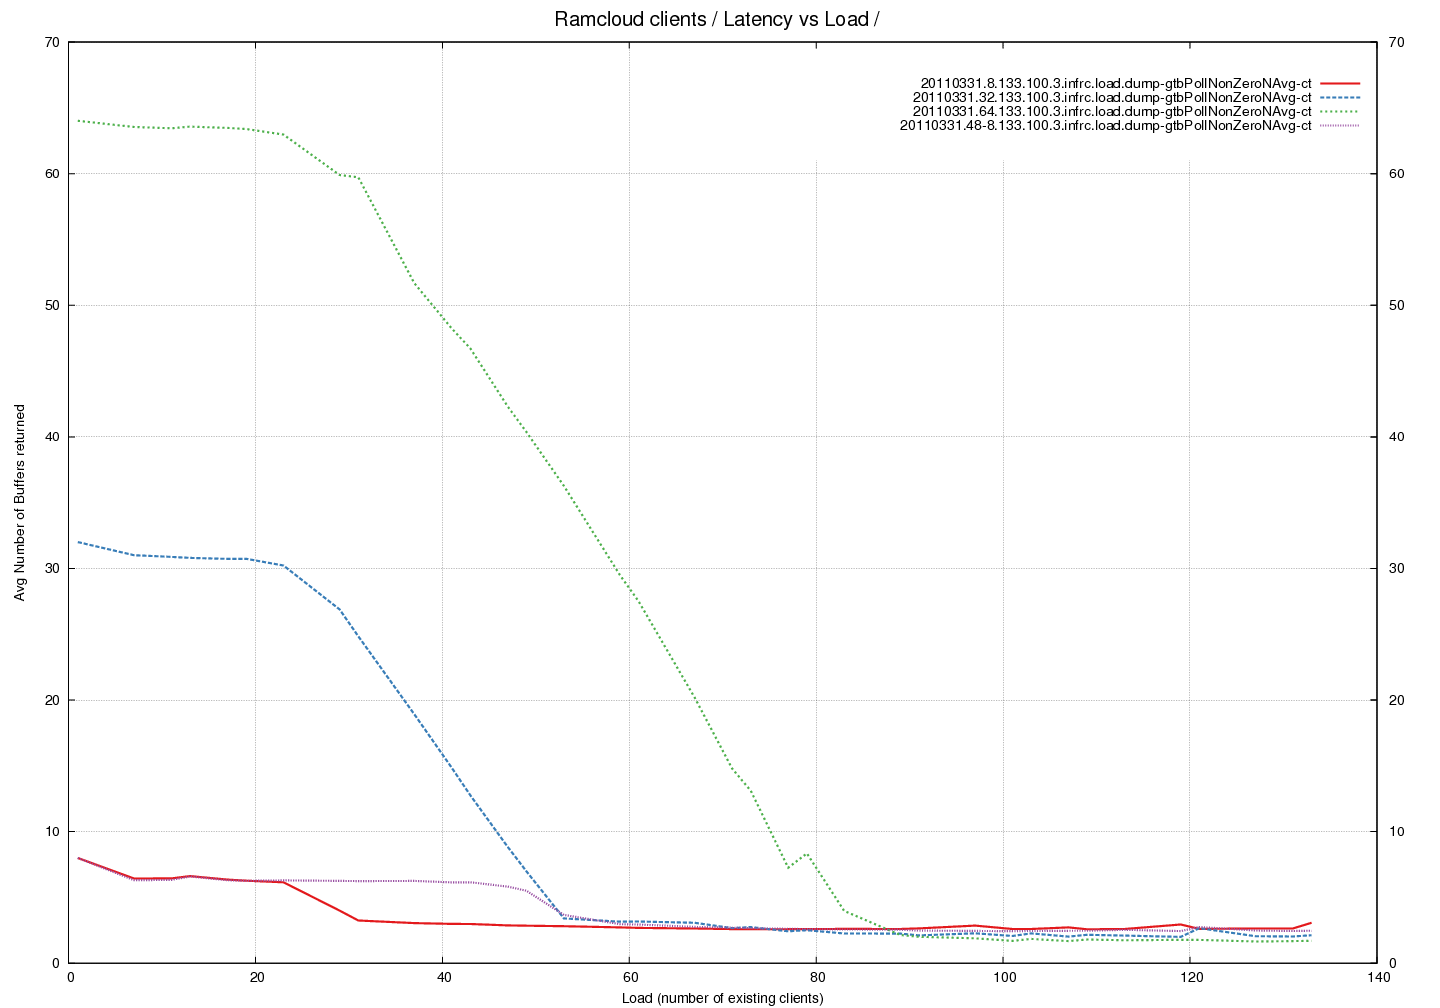
Latency Graph - Average number of buffers returned by pollCQ across different Buffer Pool sizes
Analysis
- This average does not include calls when no buffers were returned. This is an average when non-zero buffers were returned by pollCompletionQueue().
- The red, blue and green lines were measured with 24 RX buffers and
8, 32 and 64 TX buffers respectively. - The violet line was measured with 48 RX buffers and 8 TX buffers.
- An interesting trend that appears to be independent of number of
buffers in the pool. There is a drop in the average at the same load
irrespective of buffer-pool. - Why does doubling the number of receive buffers affect the number of
empty transmit buffers returned ? Compare Red against Violet. - Look at the average number of buffers returned under high load. It appears as if this number is around 3. We expect this number to be 1 buffer returned under load where empty buffers are returned as soon as they are available. The higher number indicates that maybe buffers are being returned in sets of 3. What is the reason for this behavior ?