...
| Code Block | ||
|---|---|---|
| ||
//**
  * Aggregation via traversing all SegmentEntries throughout the entire Log
  */
uint64_t
Log::aggregate()
{
  uint64_t sum = 0;

  //Iterate over all Segments in the Log
  foreach (ActiveIdMap::value_type& idSegmentPair, activeIdMap) {
        Segment* segment = idSegmentPair.second;

        //Iterate over all SegmentEntries in a Segment
        for (SegmentIterator i(segment); !i.isDone(); i.next()) {
                SegmentEntryHandle seh = i.getHandle();
                //Check that it is an Object
                if (seh->type()==560620143) {
                        const Object* obj = seh->userData<Object>();
                        int *p;
                        p = (int*) obj->data;
                        sum += *p;
                }
        }
   }
   return sum;
}
|
...
The benchmarks below have been executed using separate machines (out of the Stanford RAMCloud cluster) for client and server which are connected via Infiniband. After each run, the equality of the client-side and server-side calculated sum has been checked. During all runs, the hash table size was set to 5GB This particular benchmark allows the following conclusions:
...
.
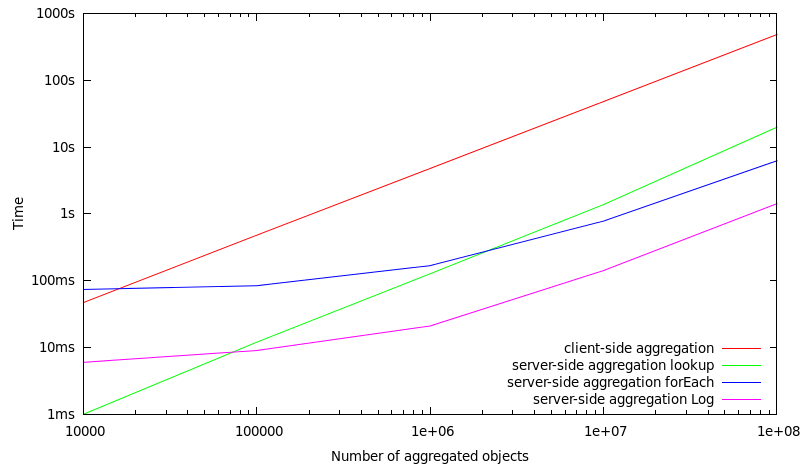
Benchmarks over all stored objects (low selectivity)
In this set of benchmarks, all objects which are stored in a MasterServer are included in the aggregation operation. Consequently, this means that if 1.000.000 objects are aggregated, there are only 1.000.000 objects stored within a MasterServer.
#number of objects | client-side aggregation | server-side aggregation | server-side aggregation | server-side aggregation |
|---|---|---|---|---|
10.000 | 47 ms | 1 ms | 74 ms | 6 ms |
100.000 | 480 ms | 12 ms | 84 ms | 9 ms |
1.000.000 | 4790 ms | 127 ms | 168 ms | 21 ms |
10.000.000 | 48127 ms | 1378 ms | 781 ms | 142 ms |
100.000.000 | 485091 ms | 19854 ms | 6245 ms | 1422 ms |
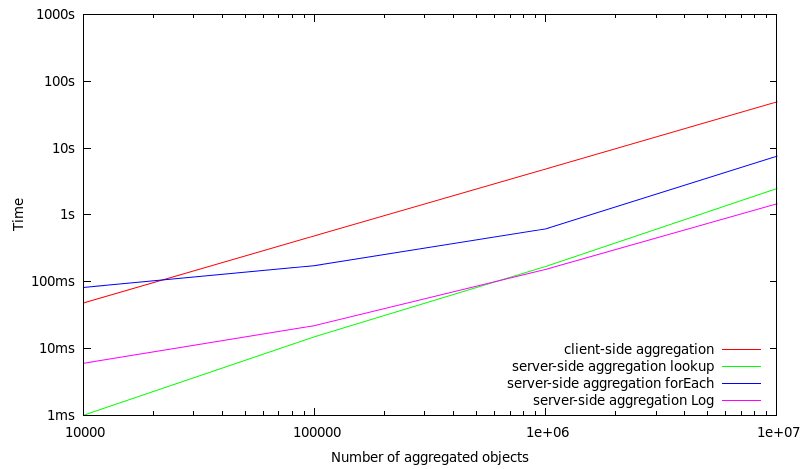
Benchmarks over a subset (10%) of stored objects (high selectivity)
In this set of benchmarks, only a subset of 10% of the objects which are stored in a MasterServer are included in the aggregation operation. Consequently, this means that if 1.000.000 objects are aggregated, there are 10.000.000 objects stored in total within a MasterServer.
#number of objects | client-side aggregation | server-side aggregation | server-side aggregation | server-side aggregation |
|---|---|---|---|---|
10.000 | 48 ms | 1 ms | 82 ms | 6 ms |
100.000 | 486 ms | 15 ms | 174 ms | 22 ms |
1.000.000 | 4865 ms | 169 ms | 618 ms | 153 ms |
10.000.000 | 49223 ms | 2481 ms | 7565 ms | 1465 ms |
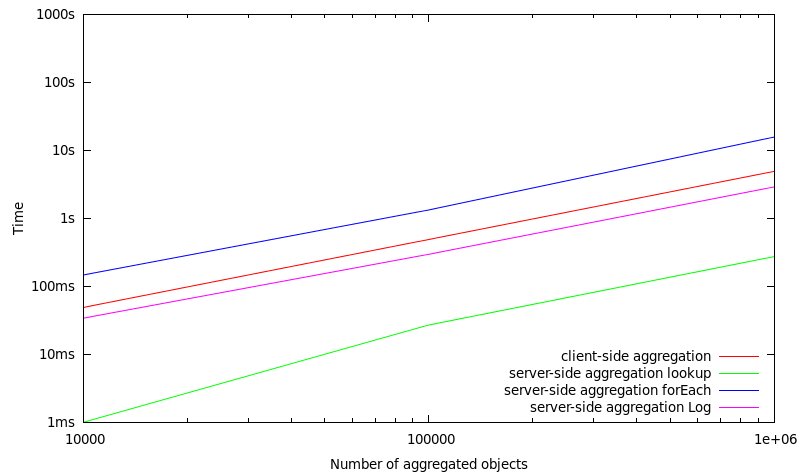
Benchmarks over a subset (0.5%) of stored objects (very high selectivity)
In this set of benchmarks, only a subset of 0.5% of the objects which are stored in a MasterServer are included in the aggregation operation. Consequently, this means that if 1.000.000 objects are aggregated, there are 200.000.000 objects stored in total within a MasterServer.
#number of objects | client-side aggregation | server-side aggregation | server-side aggregation | server-side aggregation |
|---|---|---|---|---|
10.000 | 49 ms | 1 ms | 147 ms | 34 ms |
100.000 | 489 ms | 27 ms | 1330 ms | 296 ms |
1.000.000 | 4913 ms | 274 ms | 15698 ms | 2901 ms |
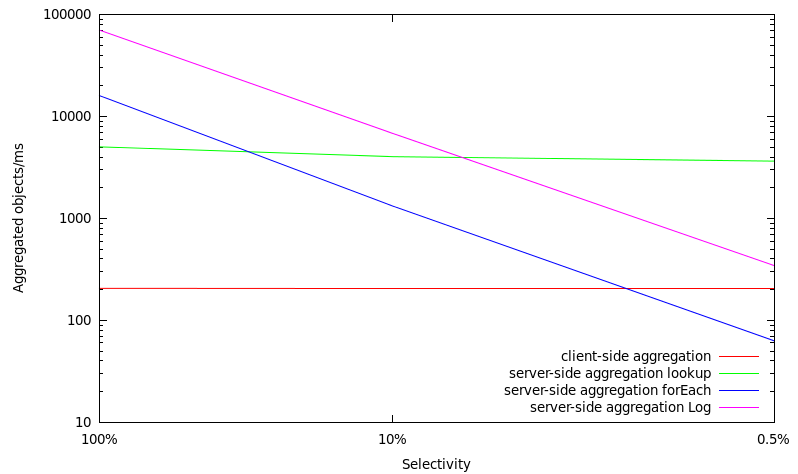
Scalability of aggregation operations with increasing selectivity
selectivity | client-side aggregation | server-side aggregation | server-side aggregation | server-side aggregation |
|---|---|---|---|---|
100% | 206 objects/ms | 5036 objects/ms | 16012 objects/ms | 70323 objects/ms |
10% | 203 objects/ms | 4030 objects/ms | 1322 objects/ms | 6825 objects/ms |
0.5% | 203 objects/ms | 3650 objects/ms | 63 objects/ms | 345 objects/ms |
Conclusions
This previous benchmarks allow the following conclusions:
- When aggregating all objects stored in a MasterServer (low selectivity), an performance increase of 25x can be seen when aggregating via hash table lookups on the server-side and an increase of 75x can be seen when aggregating via hash table forEach iteration on the server-side. When neglecting the hash table structure and directly going over the Log, an increase of 340x can be seen.
- When aggregating over a 10% subset of all objects stored in a MasterServer (high selectivity), an performance increase of 20x can be seen when aggregating via hash table lookups on the server-side and an increase of 6x can be seen when aggregating via hash table forEach iteration on the server-side. When neglecting the hash table structure and directly going over the Log, an increase of 33x can be seen when going over a total number of 10.000.000 objects.
- Hash table lookups seem to be preferable over a forEach iteration when focusing on server-side aggregation via the hash table and having a high selectivity.
- When traversing a set of distinct objects, retrieving a single object takes about 7-8?s (or a RAMCloud client can request about 130.000 objects/sec from a single RAMCloud server).
- When invoking the hashTable forEach method the whole allocated memory for the hashtable has to be traversed. This is fine if the hashtable is densely packed with objects. In case of a sparse population with objects this introduces a penalty.
Disaggregation Operation
#number of objects | client-side aggregation | server-side aggregation | server-side aggregation Disaggregation via | server-side aggregation | lookup with 0 backups |
|---|---|---|---|---|---|
10.000 | 63 1 ms | 2 ms | 238 ms | 6 4 ms | |
100.000 | 648 11 ms | 23 50 ms | 251 ms | 9 ms | |
1.000.000 | 6485 124 ms | 233 ms | 369 515 ms | 21 ms | |
10.000.000 | 64258 1413 ms | 2662 ms | 1444 ms | 142 ms | |
100.000.000 | 652201 ms | 30049 ms | 18752 ms | 1422 ms |
...
5411 ms |