...
- Number of rpcs
- Internal Hash-table size
- Actual DRAM used versus raw DRAM required for object contents
Graphs of interest
...
Round 6 - InfRC - (generated with code version - commit 24f6d2)
- New cluster with 36 nodes total used.
- master/coord at rc01.rccluster. clients on all other nodes - rc01-36.rccluster
- latency and throughput curves measured for different objects sizes read under load (both quantities are measured in the same experiment)
- only reads are measured - single object within a single table is read
- Object sizes at 100, 1000 and 10000 bytes
- transport=infrc, Throughput versus load
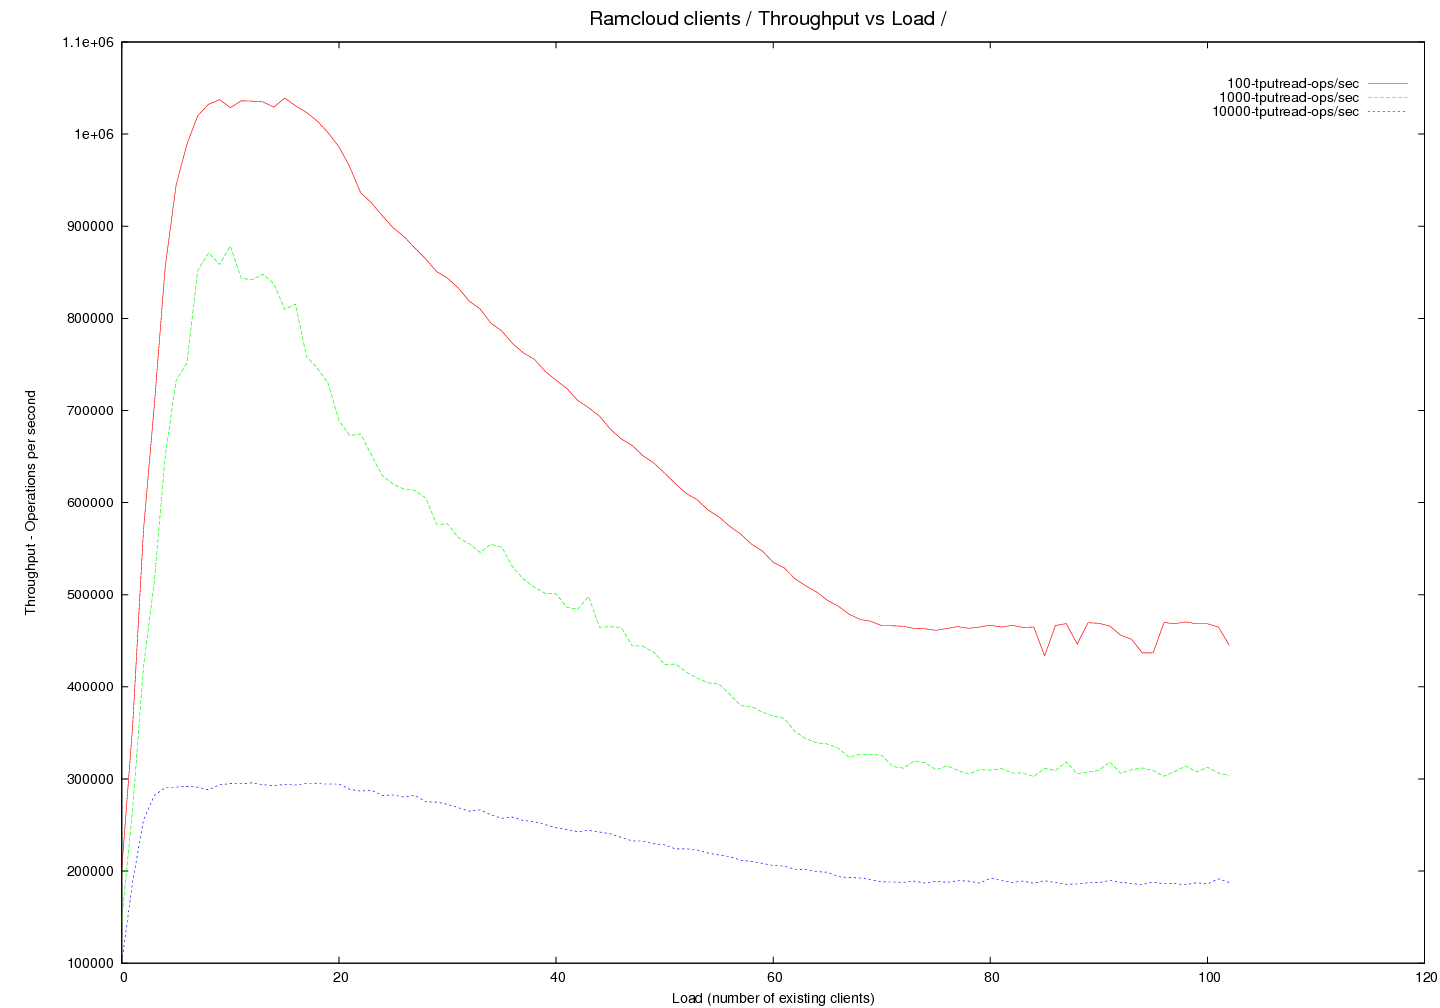 Image Added
- transport=infrc, Latency versus load
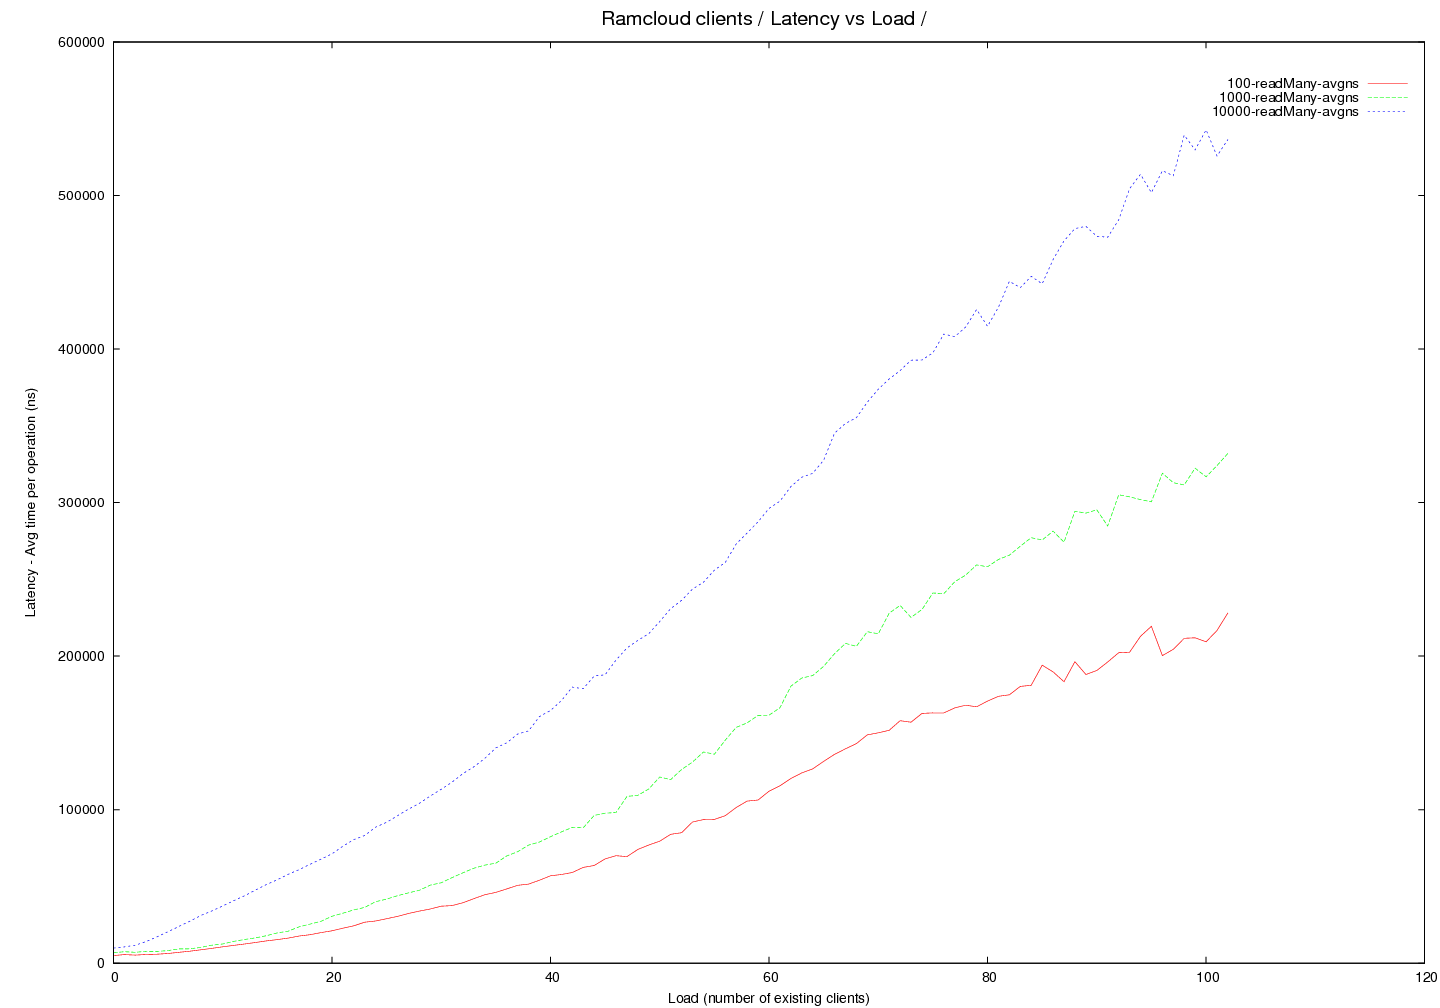 Image Added
Round 5 - InfRC - (generated with code version - commit 24f6d2)
- New cluster with 33 nodes total used.
- master/coord at rc01.rccluster. clients on all other nodes - rc01-36.rccluster
- different objects sizes
- load vs time-per-operation measurements only.
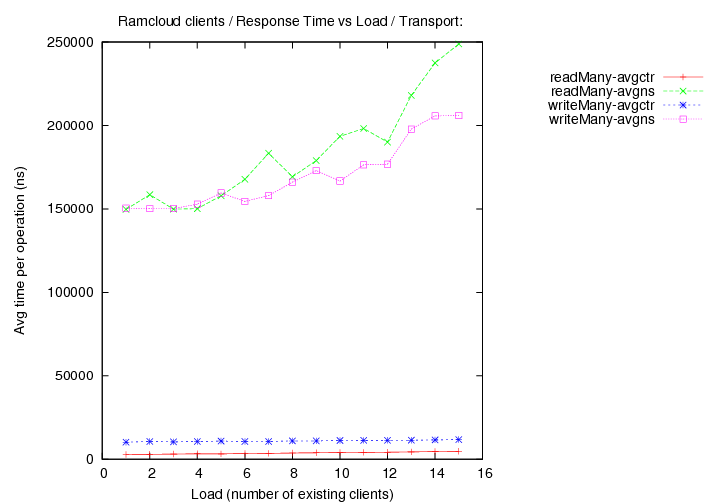
- transport=infrc, Operations per second (throughput) versus load with 1000 byte objects
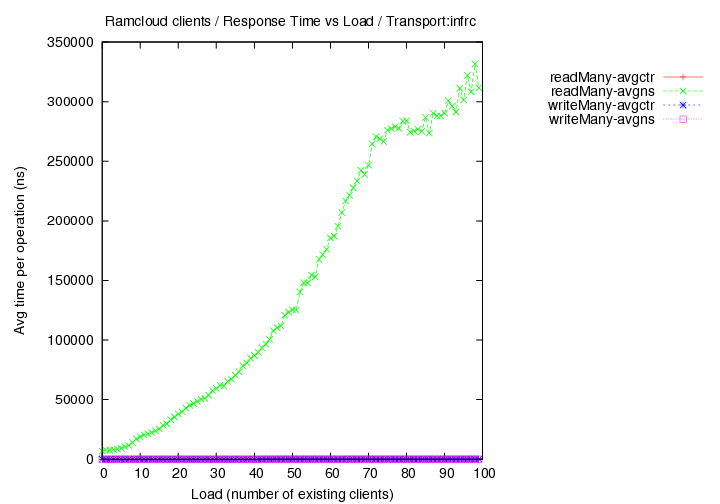 Image Added
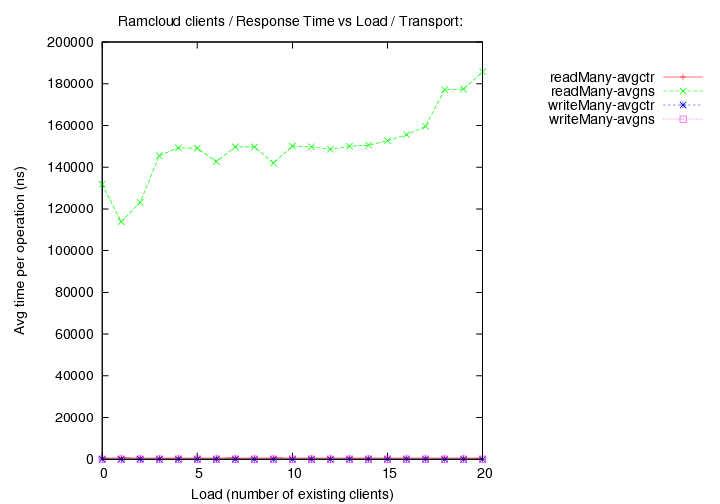
- transport=infrc, Operations per second (throughput) versus load with 100 byte objects
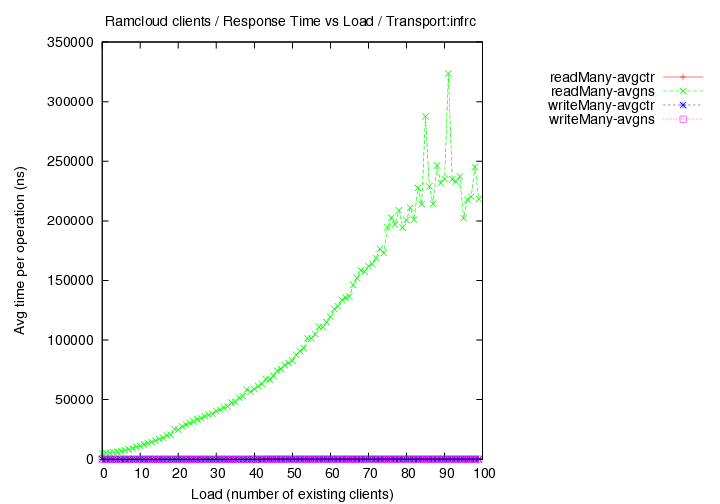 Image Added
Round 4 - InfRC - (generated with code version - commit db388ad3)
- Reference measurement - Steve's access of 100 byte objects on single server - 7000 ns
- Single server round trip time - 100,000 measurements - 100 byte objects in 4833 ns run-bench script
- No load - 100,000 measurements - master/co-ord on rc01, client on rc02 - 100 byte objects in 5109 ns run-perf script
- No load - 10,000,000 measurements - master/co-ord on rc01, client on rc02 - 1000 byte objects in 5093 ns run-perf script
- 10.0.0.x NICs were used.
- 1 hour passes - cluster is as idle as the last experiment. But.....
- Single server round trip time - 100,000 measurements - 100 byte objects in 9869 ns run-bench script
- No load - 100,000 measurements - master/co-ord on rc01, client on rc02 - 100 byte objects in 9878 ns run-perf script
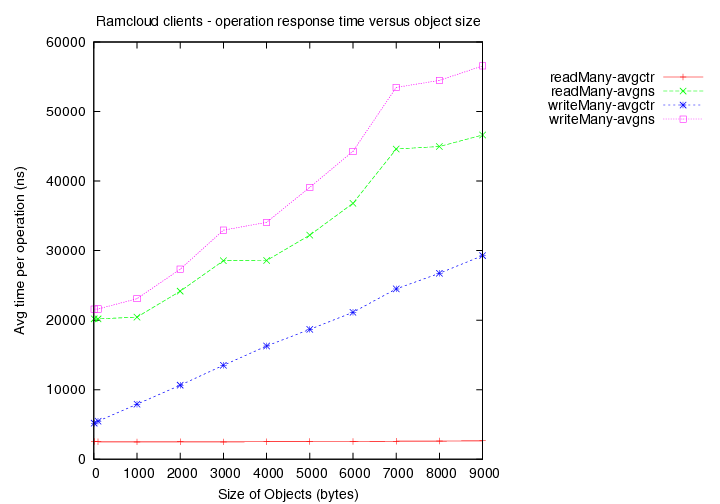
- transport=infrc, Operations per second (throughput) versus object size
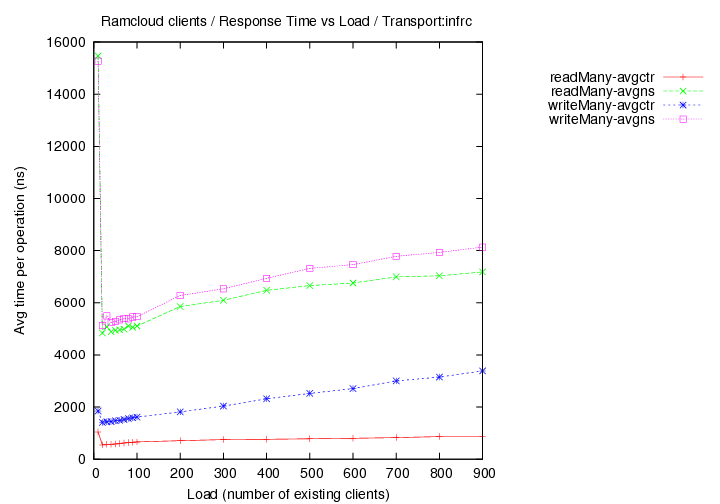 Image Added
Round 3 - (generated with code version - commit db388ad3)
- Co-ordinator and Server are both running on rc01
- Client making timing measurements is at rc03 - the queen
- Load - additional clients are run on rc04-6. If load > 3 is required, multiple clients are run on the same node. The Workers.
- Builds are with DEBUG=no unless otherwise noted.
- Object size is fixed at 1000 bytes.
...
- transport=fast+udp, Operations per second (throughput) versus load (number of running clients).
...
Round 2 - (generated with code version - commit 7a861e)
- Co-ordinator and Server are both running on rc01
- Client making timing measurements is at rc02
- Load - additional clients are run on rc03-8. If load > 6 is required, multiple clients are run on the same node.
- Builds are with DEBUG=no unless otherwise noted.
- Object size is fixed at 1000 bytes.
- Each "load" client is another instance of Bench, each running ten times as many operations as the measuring Bench client with continuous operations)
...
- DEBUG=yes, transport=fast+udp, Operations per second (throughput) versus load (number of running clients).
...
Round 1 - (generated with code version - commit b6af37)
- Time taken for reads (avg latency in ns) versus object size.
- Time taken for writes (avg latency in ns) versus object size.
(avgns times are as measured at client side. avgctr times are as measured at server using the serverCounter.)
...
{"serverDuration": 445, "requestCorrelationId": "4a6146c262184603a50f5e09fd04419e"}