Workload Generator
- Nandu Jayakumar
Generation of workloads to test RAMCloud
This document defines a simple plan to evaluate the performance and scalability of RAMCloud. The first section lists the dimensions we need to take into consideration and the final measurements we should end up with. The third section has ideas for simulated workload situations under which these measurements could be made in the future.
Measurements of interest
The ordering indicates relative importance in the lists that follow. Only the first 2-3 are likely to be attempted to start things off.
At first these measurements could be made on a simple set-up with a single node running master/coordinator/backup/client.
Client's perspective
- Latency under no-load
Input parameters - Object Size, Type of operation (Object vs Table, Read vs Write), Capacity of RAMCloud in use, Master failures, Object access distribution (Zipf?)
Output measured in - micro seconds
Measured end-to-end from the perspective of the client. - Throughput of operations
Input parameters - Object Size distribution, Type of operation, Object access distribution, Capacity of RAMCloud in use, Master failures
Output measured in - number of object reads per second, number of object writes per second - Throughput of IO
Input parameters - Object Size distribution, Type of operation, Object access distribution, Capacity of RAMCloud in use, Master failures
Output measured in - number of client bytes reads per second, number of client byte writes per second (ideally should only include real content size and not count the overhead imposed by RAMCloud structures) - Maximum simultaneous Connections
Input parameters - Number of masters, Number of client processes, Number of client machines
Output measured in - number of connections - Latency under load
Input parameters - Number of operations under load, Object Size, Type of operation (Object vs Table, Read vs Write), Capacity of RAMCloud in use, Master failures, Object access distribution (Zipf?)
Output measured in - micro seconds
A pre-defined workload is first imposed on the system in terms of number of simultaneous operations. Latency measurements are then made for each type of operation.
Of internal interest
- Number of rpcs
- Internal Hash-table size
- Actual DRAM used versus raw DRAM required for object contents
Graphs of interest
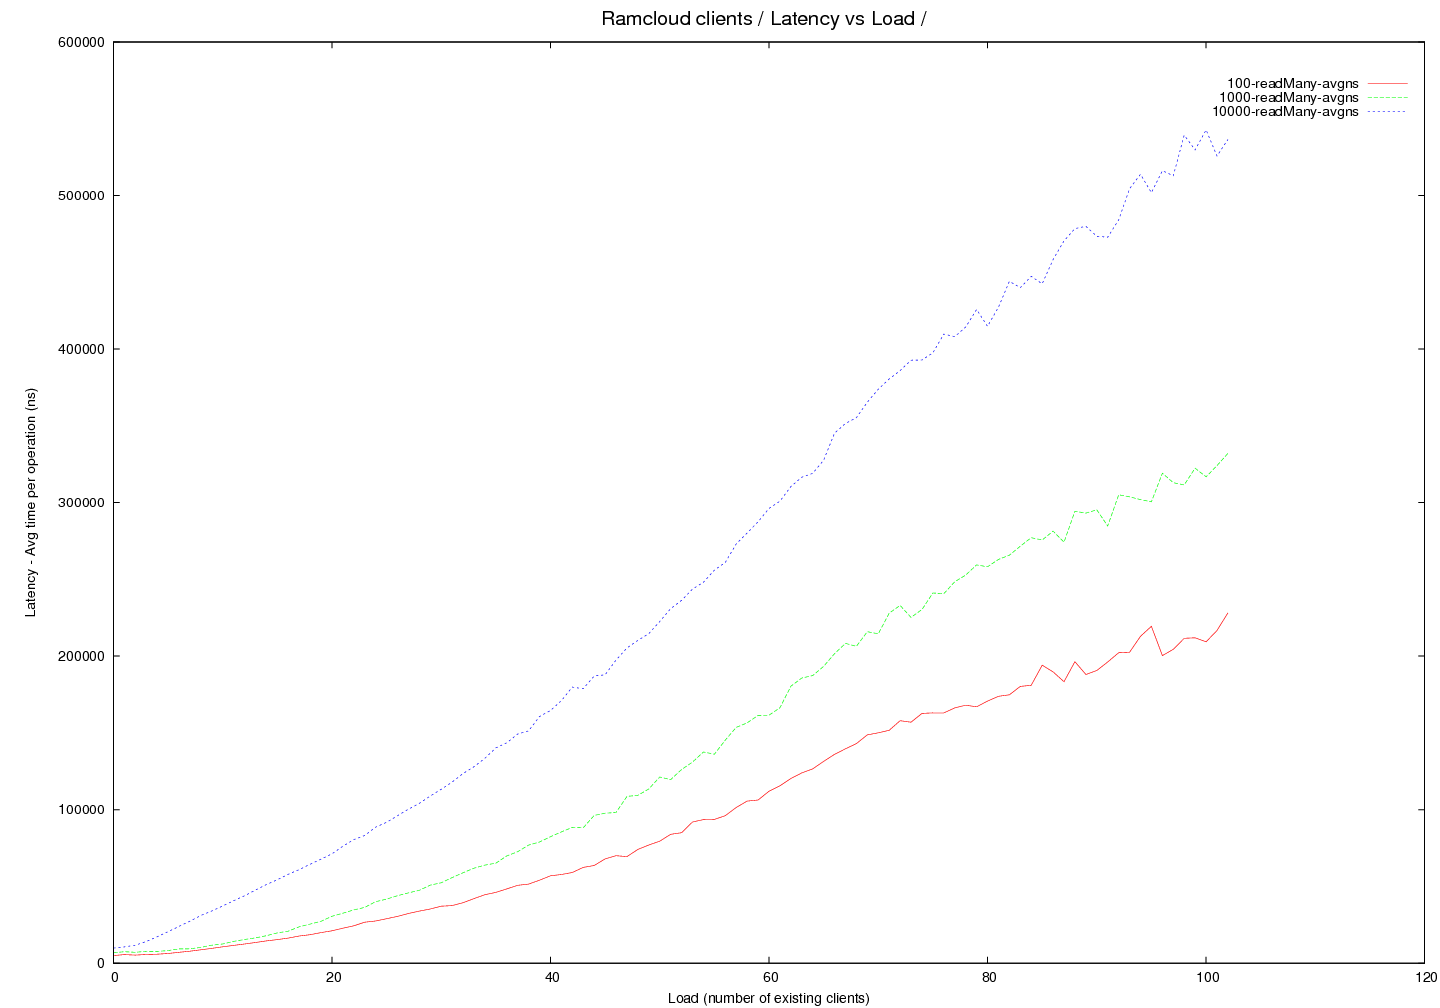
Round 6 - InfRC - (generated with code version - commit 24f6d2)
- New cluster with 36 nodes total used.
- master/coord at rc01.rccluster. clients on all other nodes - rc01-36.rccluster
- latency and throughput curves measured for different objects sizes read under load (both quantities are measured in the same experiment)
- only reads are measured - single object within a single table is read
- Object sizes at 100, 1000 and 10000 bytes
- transport=infrc, Throughput versus load
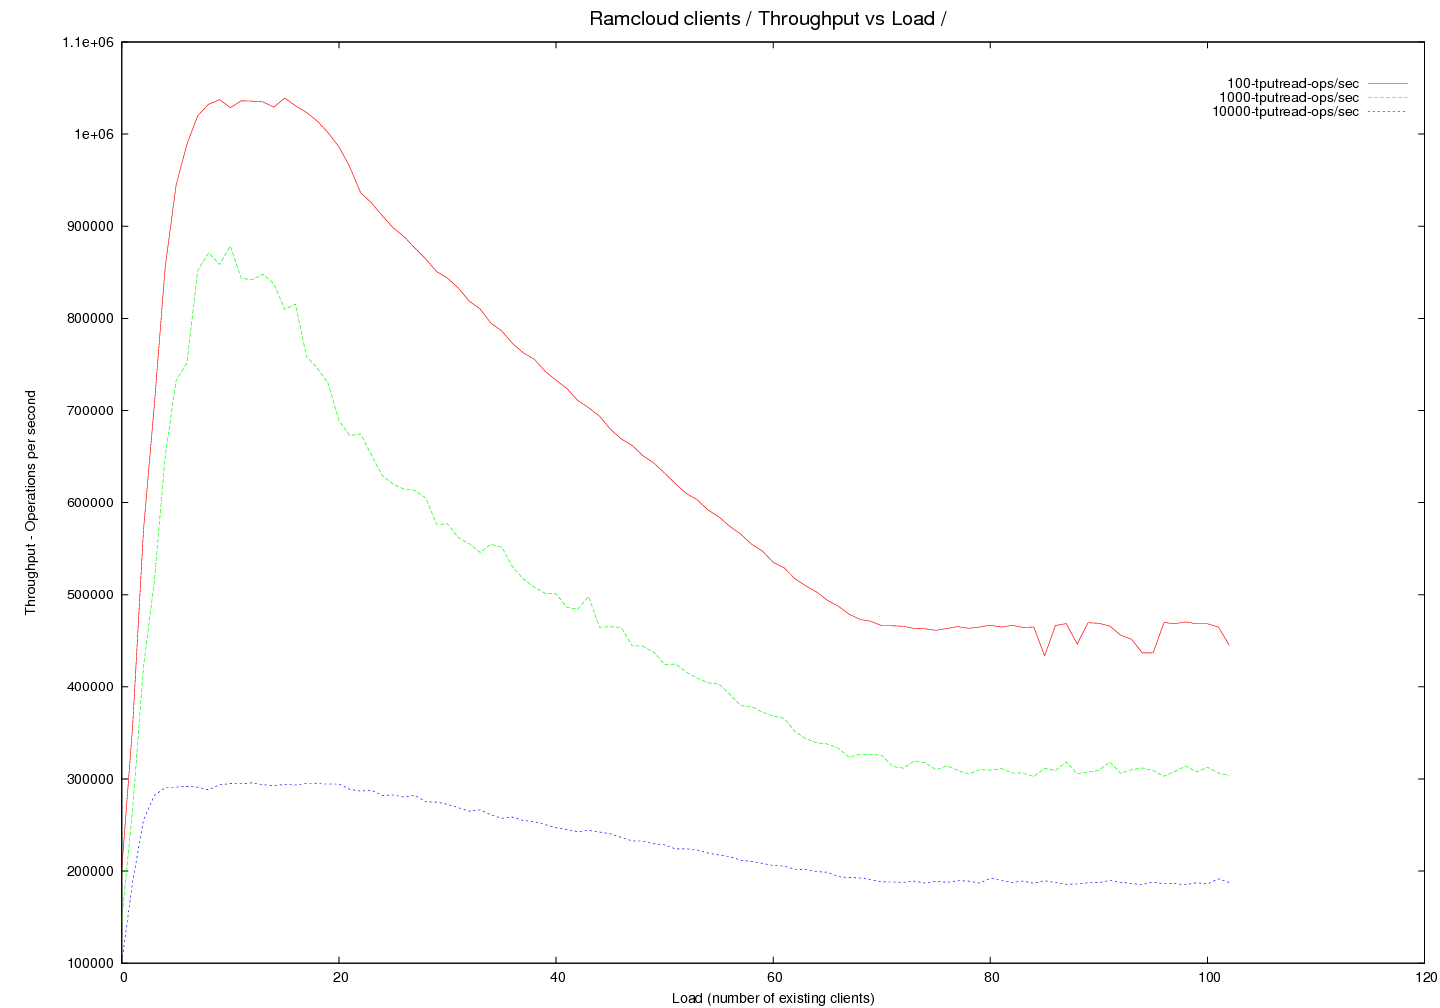
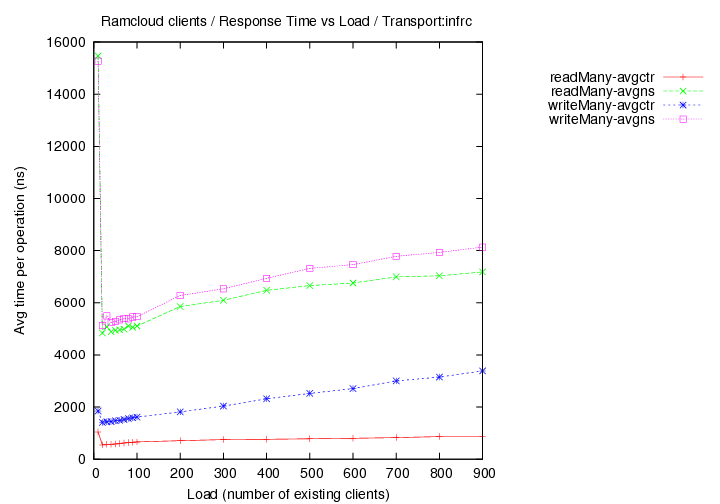
- transport=infrc, Latency versus load
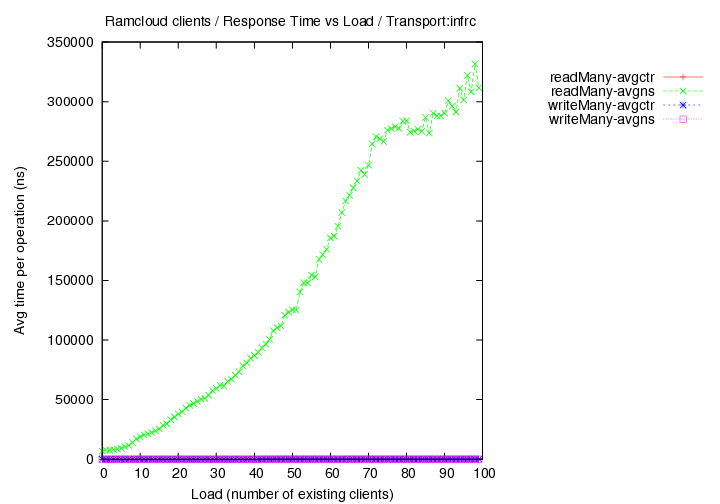
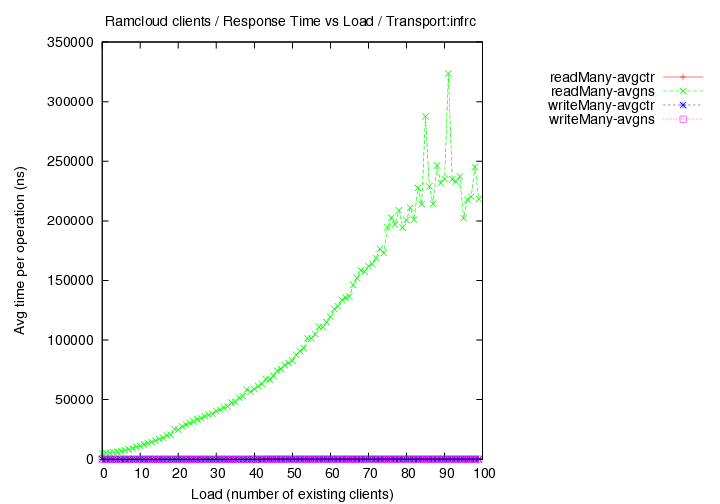
Round 5 - InfRC - (generated with code version - commit 24f6d2)
- New cluster with 33 nodes total used.
- master/coord at rc01.rccluster. clients on all other nodes - rc01-36.rccluster
- different objects sizes
- load vs time-per-operation measurements only.
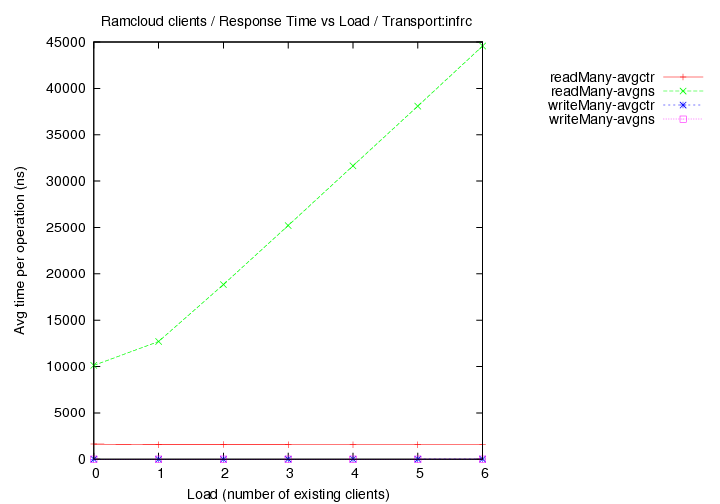
- transport=infrc, Operations per second (throughput) versus load with 1000 byte objects
- transport=infrc, Operations per second (throughput) versus load with 100 byte objects
Round 4 - InfRC - (generated with code version - commit db388ad3)
- Reference measurement - Steve's access of 100 byte objects on single server - 7000 ns
- Single server round trip time - 100,000 measurements - 100 byte objects in 4833 ns run-bench script
- No load - 100,000 measurements - master/co-ord on rc01, client on rc02 - 100 byte objects in 5109 ns run-perf script
- No load - 10,000,000 measurements - master/co-ord on rc01, client on rc02 - 1000 byte objects in 5093 ns run-perf script
- 10.0.0.x NICs were used.
- 1 hour passes - cluster is as idle as the last experiment. But.....
- Single server round trip time - 100,000 measurements - 100 byte objects in 9869 ns run-bench script
- No load - 100,000 measurements - master/co-ord on rc01, client on rc02 - 100 byte objects in 9878 ns run-perf script
- transport=infrc, Operations per second (throughput) versus object size
Round 3 - (generated with code version - commit db388ad3)
- Co-ordinator and Server are both running on rc01
- Client making timing measurements is at rc03 - the queen
- Load - additional clients are run on rc04-6. If load > 3 is required, multiple clients are run on the same node. The Workers.
- Builds are with DEBUG=no unless otherwise noted.
- Object size is fixed at 1000 bytes.
- transport=infrc, Operations per second (throughput) versus load (number of running clients).
- transport=tcp, Operations per second (throughput) versus load (number of running clients).
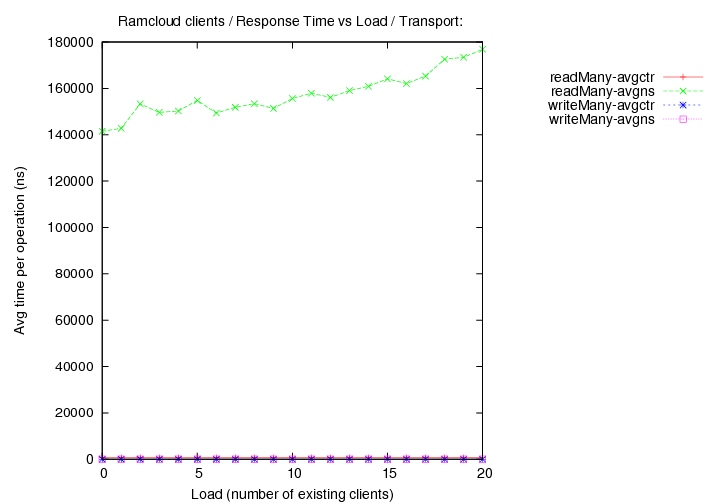
- transport=fast+udp, Operations per second (throughput) versus load (number of running clients).
Round 2 - (generated with code version - commit 7a861e)
- Co-ordinator and Server are both running on rc01
- Client making timing measurements is at rc02
- Load - additional clients are run on rc03-8. If load > 6 is required, multiple clients are run on the same node.
- Builds are with DEBUG=no unless otherwise noted.
- Object size is fixed at 1000 bytes.
- Each "load" client is another instance of Bench, each running ten times as many operations as the measuring Bench client with continuous operations)
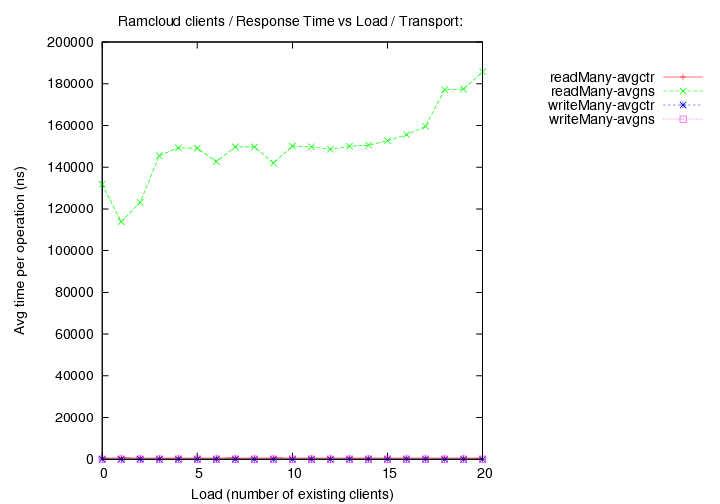
- transport=infrc, Operations per second (throughput) versus load (number of running clients).
- transport=tcp, Operations per second (throughput) versus load (number of running clients).
- transport=fast+udp, Operations per second (throughput) versus load (number of running clients).
- DEBUG=yes, transport=fast+udp, Operations per second (throughput) versus load (number of running clients).
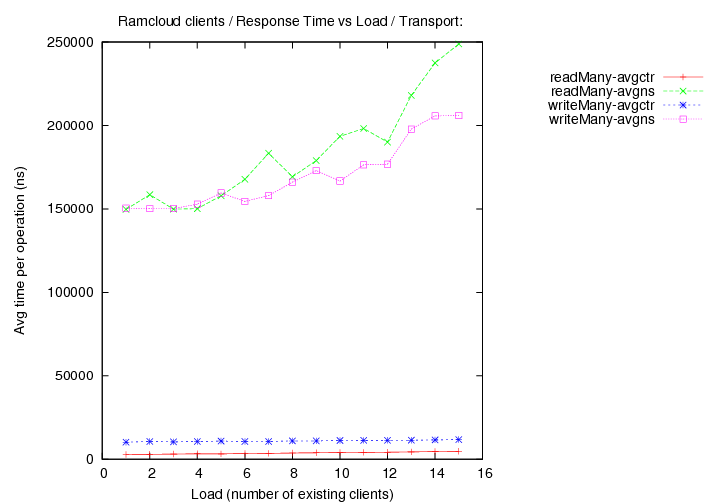
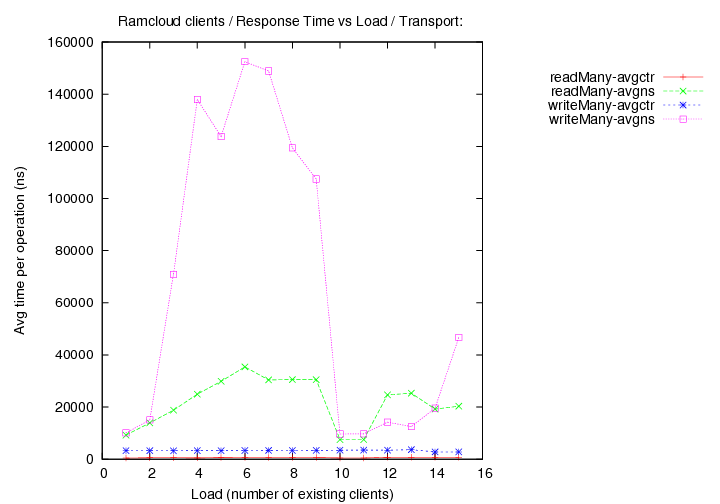
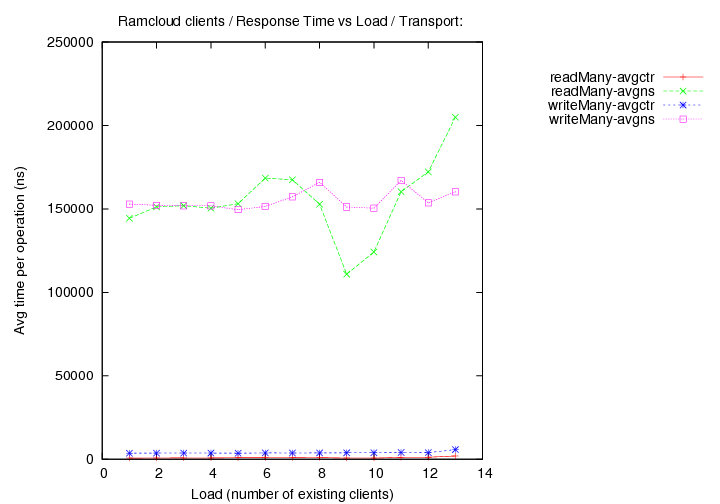
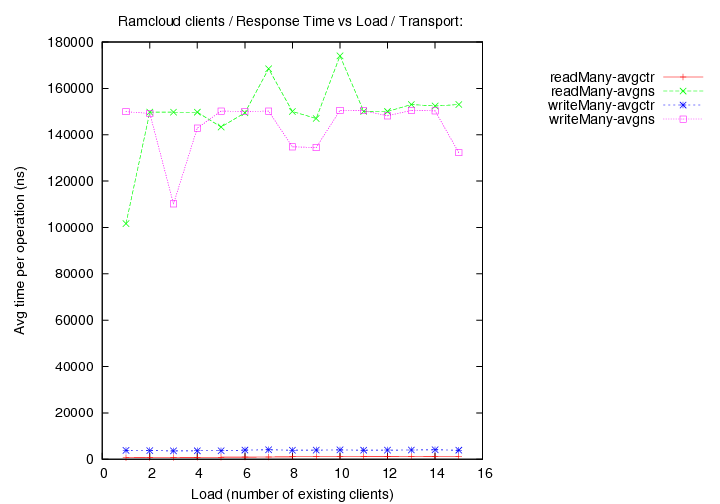
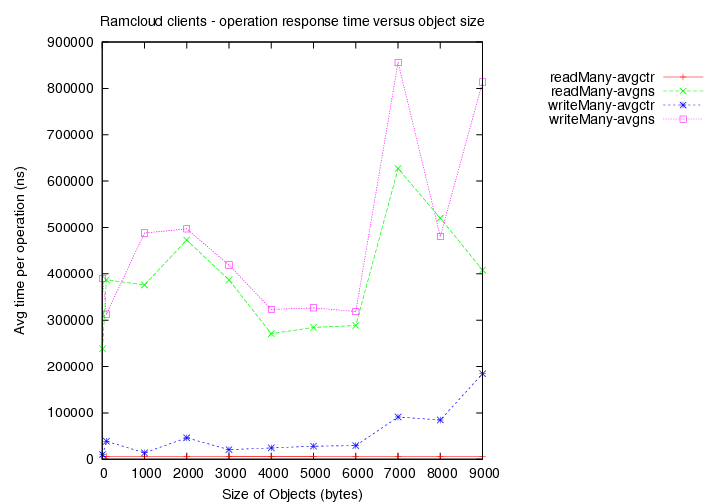
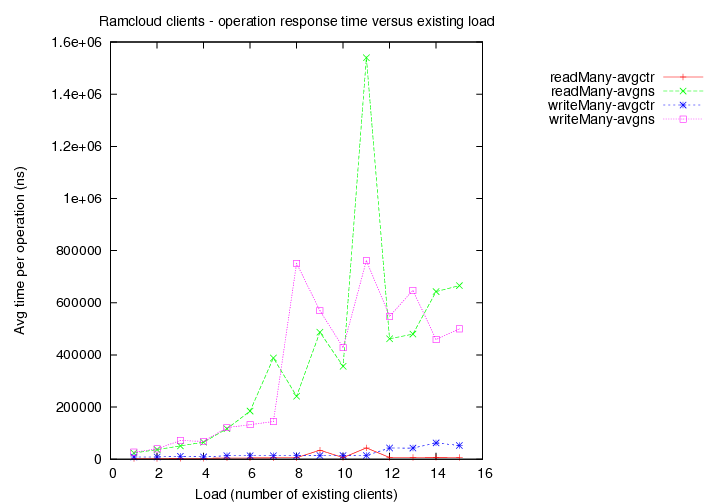
Round 1 - (generated with code version - commit b6af37)
- Time taken for reads (avg latency in ns) versus object size.
- Time taken for writes (avg latency in ns) versus object size.
(avgns times are as measured at client side. avgctr times are as measured at server using the serverCounter.)
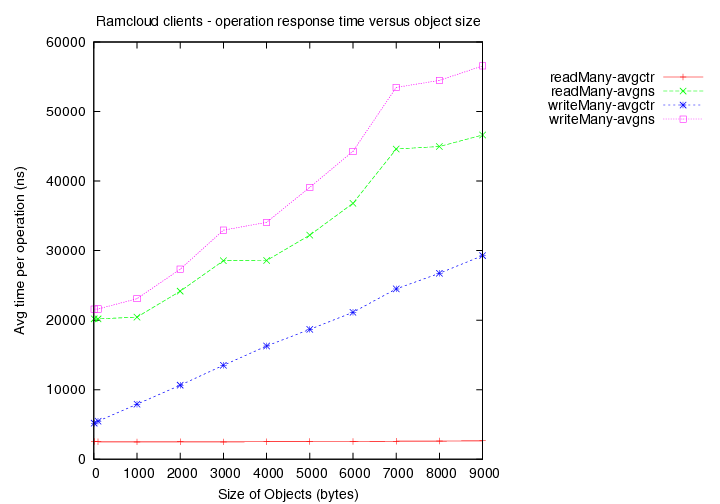
- Existing load = 1 client with 1000 byte objects
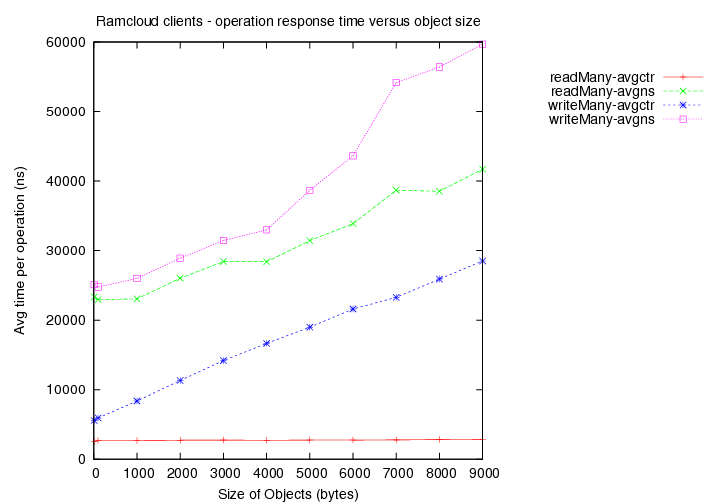
- Existing load = 2 clients with 1000 byte objects
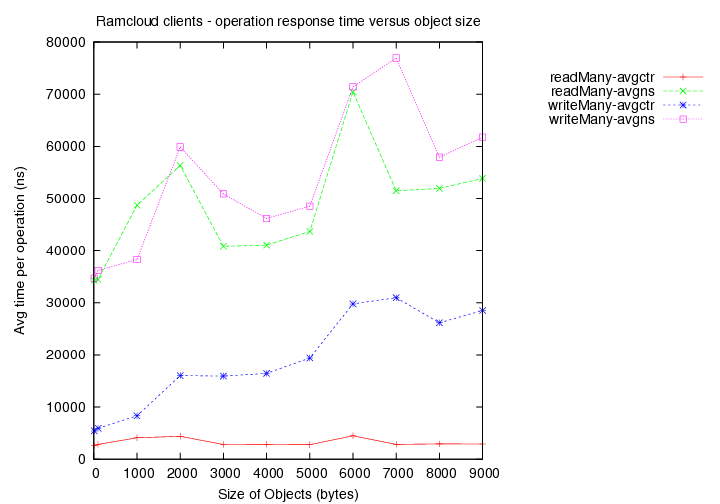
- Existing load = 5 clients with 1000 byte objects
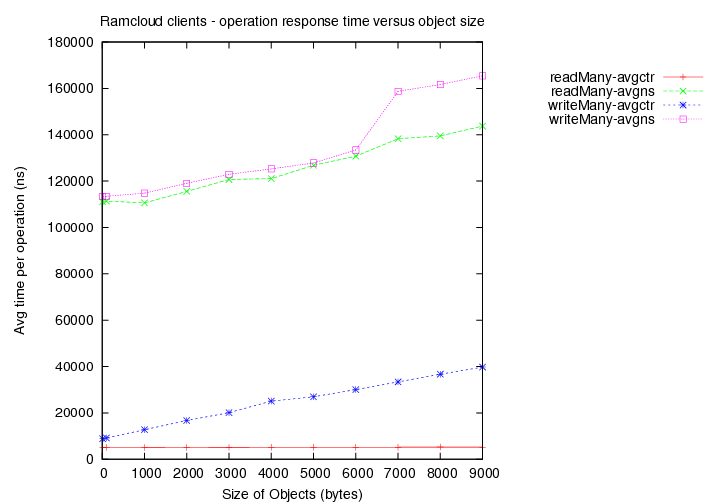
- Existing load = 10 clients with 1000 byte objects
- Operations per second (throughput) versus load (number of running clients, fixed object size of 1000 bytes).
(each client is another instance of Bench, each running ten times as many operations as the measuring Bench binary with continuous operations)
Simulated workload types
1- Banking Website
This workload represents a simple banking website that stores all of its webpages as objects in a RAMCloud. Inspired by the specweb2009 benchmark, the ratio of reads to writes in this system is 95:5.
The objects are distributed in size as indicated in the table below.
Size |
% of Objects |
|---|---|
100B-1K |
35% |
1K-10K |
50% |
10K-100K |
14% |
100K-1M |
1% |
It is assumed that the objects are spread out over 10 tables of equal size. These tables are not assumed to be pre-filled. Any reads of objects that do not exist will fail and are counted as valid reads in the measurements. The writes will fill the tables with objects as they happen. Initially the pattern of reads and writes is generated in a random manner.
Assuming a 4GB capacity RAMCloud, we can start with 300 MB tables and generate as many objects as required based on the size distribution constraint.
2- Dynamic Page Generation for a website
This represents a webpage that contains multiple sections. These sections are generated by making calls to services that populate them. Each of these services in turn contacts the RAMCloud to query various objects of interest. We assume that 50 services are involved with 20 distinct tables. New page segments are generated only 10 times every day. These pages are served some 200 million times every day. This puts the read to write ratio at 20 million : 1. We assume that there are no special "hot" page configurations and that they are all equally likely to be used in generating the web page.
Assuming a 4GB capacity RAMCloud, we can start with 19 tables of 150 MB each and a single table of 1GB. All the writes can occur in a burst in the beginning to fill the RAMCloud. This represents the 10 times-a-day page generation cycle (assuming it is a batch-based generation scheme). After this point we follow up simply with reads at as high a rate as possible.