...
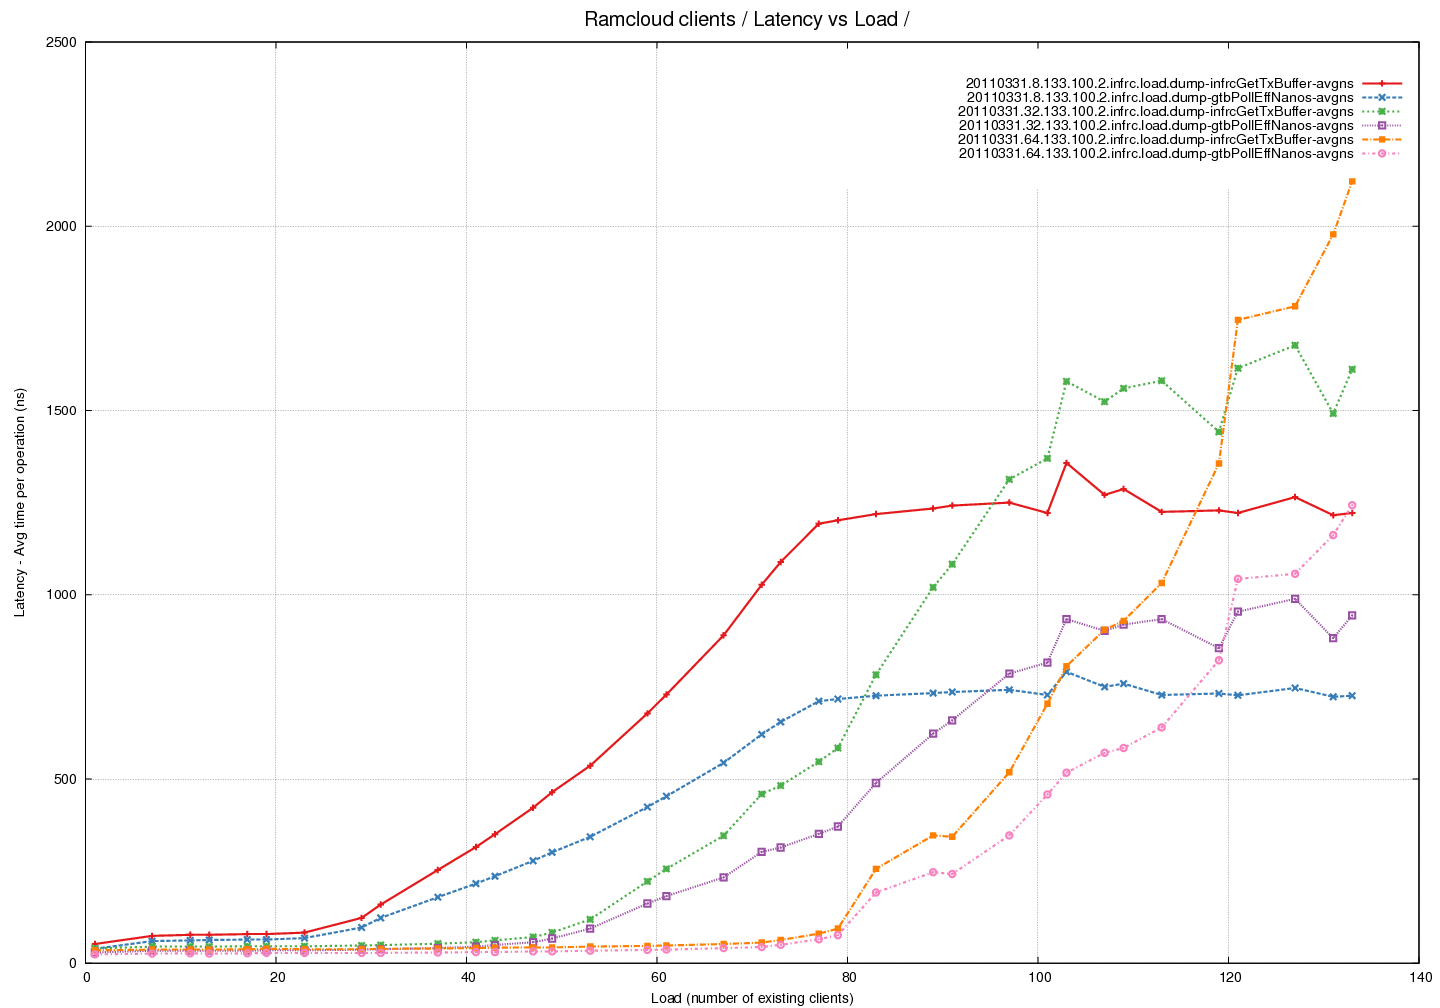
Latency Graph - Time spent in pollCQ per read (average) across different Transmit Buffer Pool sizes
- Total time spent in pollCQ was tracked and then divided by the number of read calls to calculate the average.
- This tracks the curve of time spent within the getTransmitBuffer call well. The difference between the two needs to be explained.
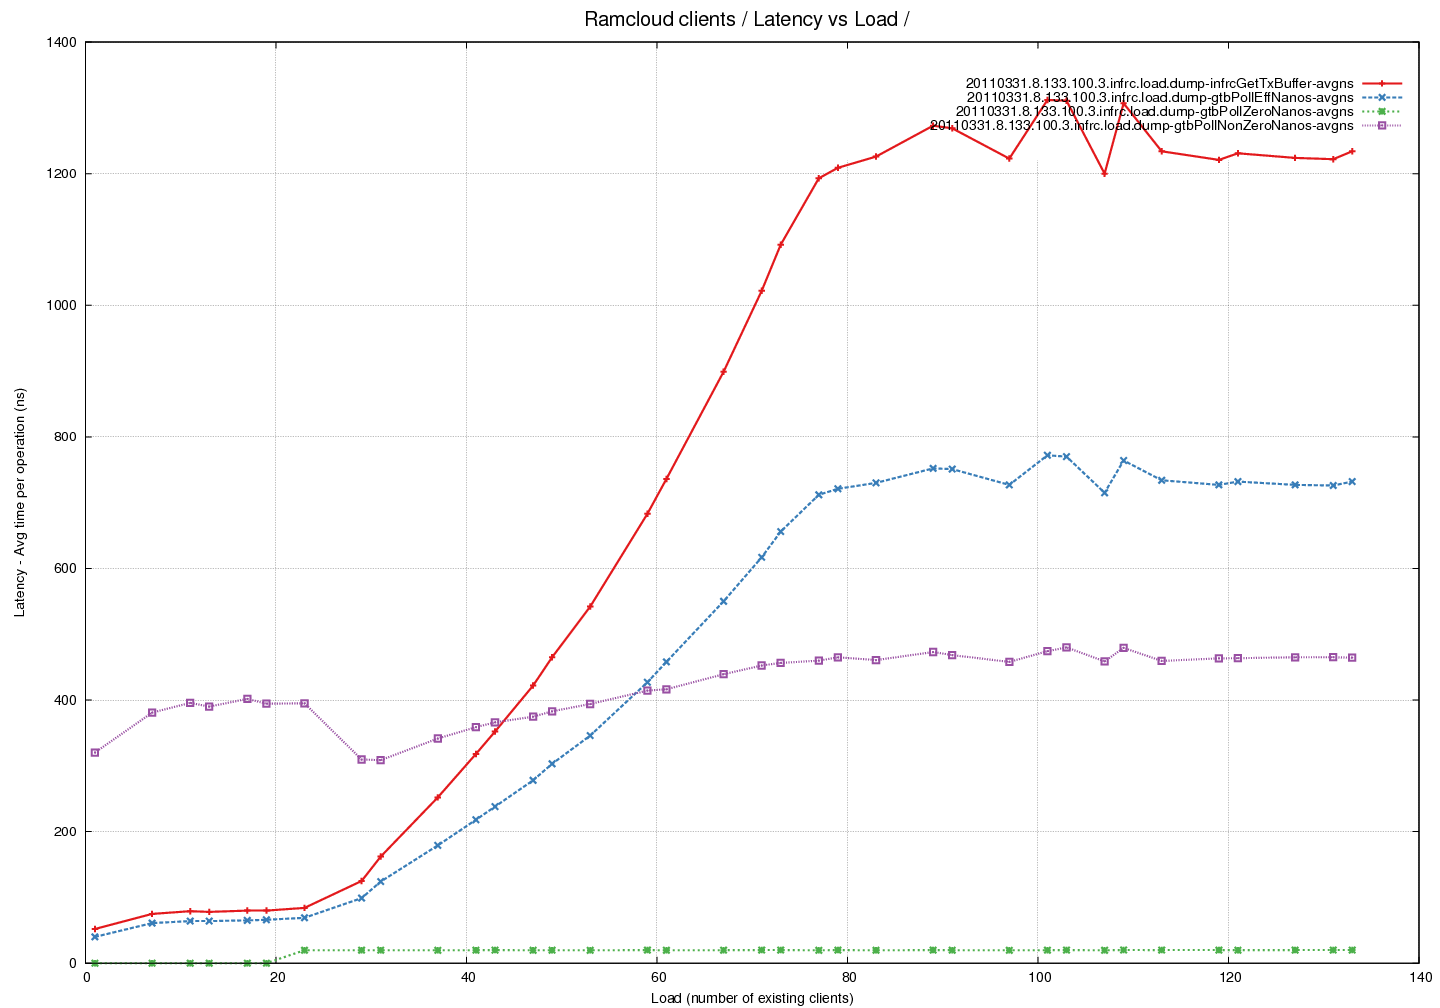
Latency Graph - Time spent in pollCQ per read (average) - fixed pool of buffers - comparing time taken by successful calls against calls that return 0
- Note that time taken per unsuccessful call
Latency Graph - Average number of buffers returned by pollCQ across different Buffer Pool sizes
...