Goal
Measure and understand the performance of Infiniband under load
Parameters of the experiments
Results/Graphs
Reference Graph - Throughput of the system for 100 byte object reads using different Transmit Buffer Pool sizes
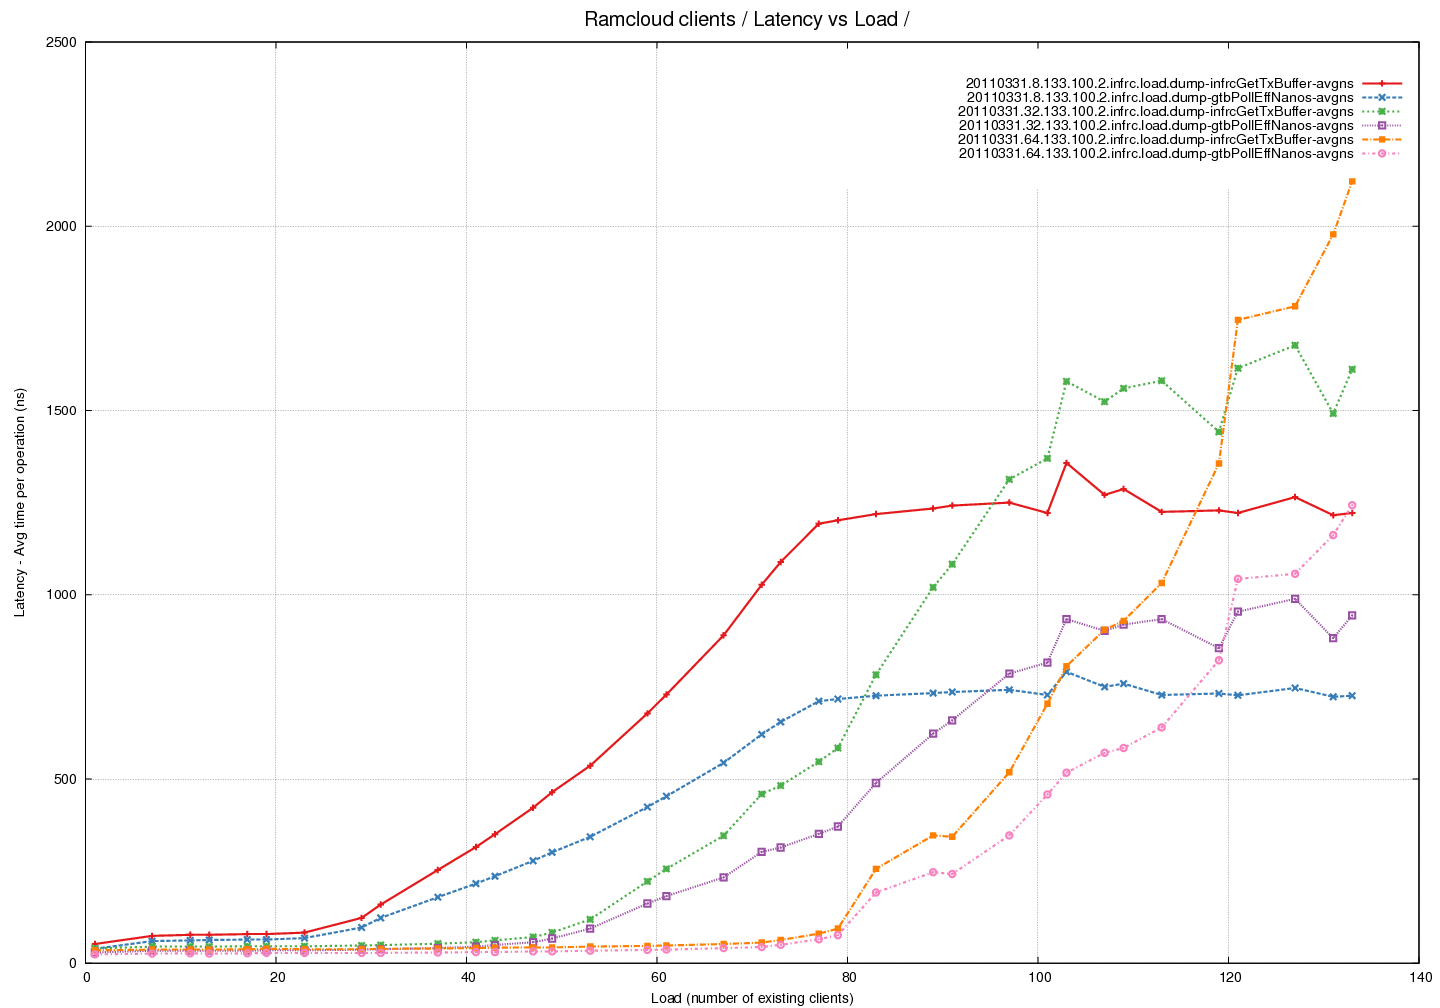
Latency Graph - Time spent in pollCQ per read (average) across different Transmit Buffer Pool sizes
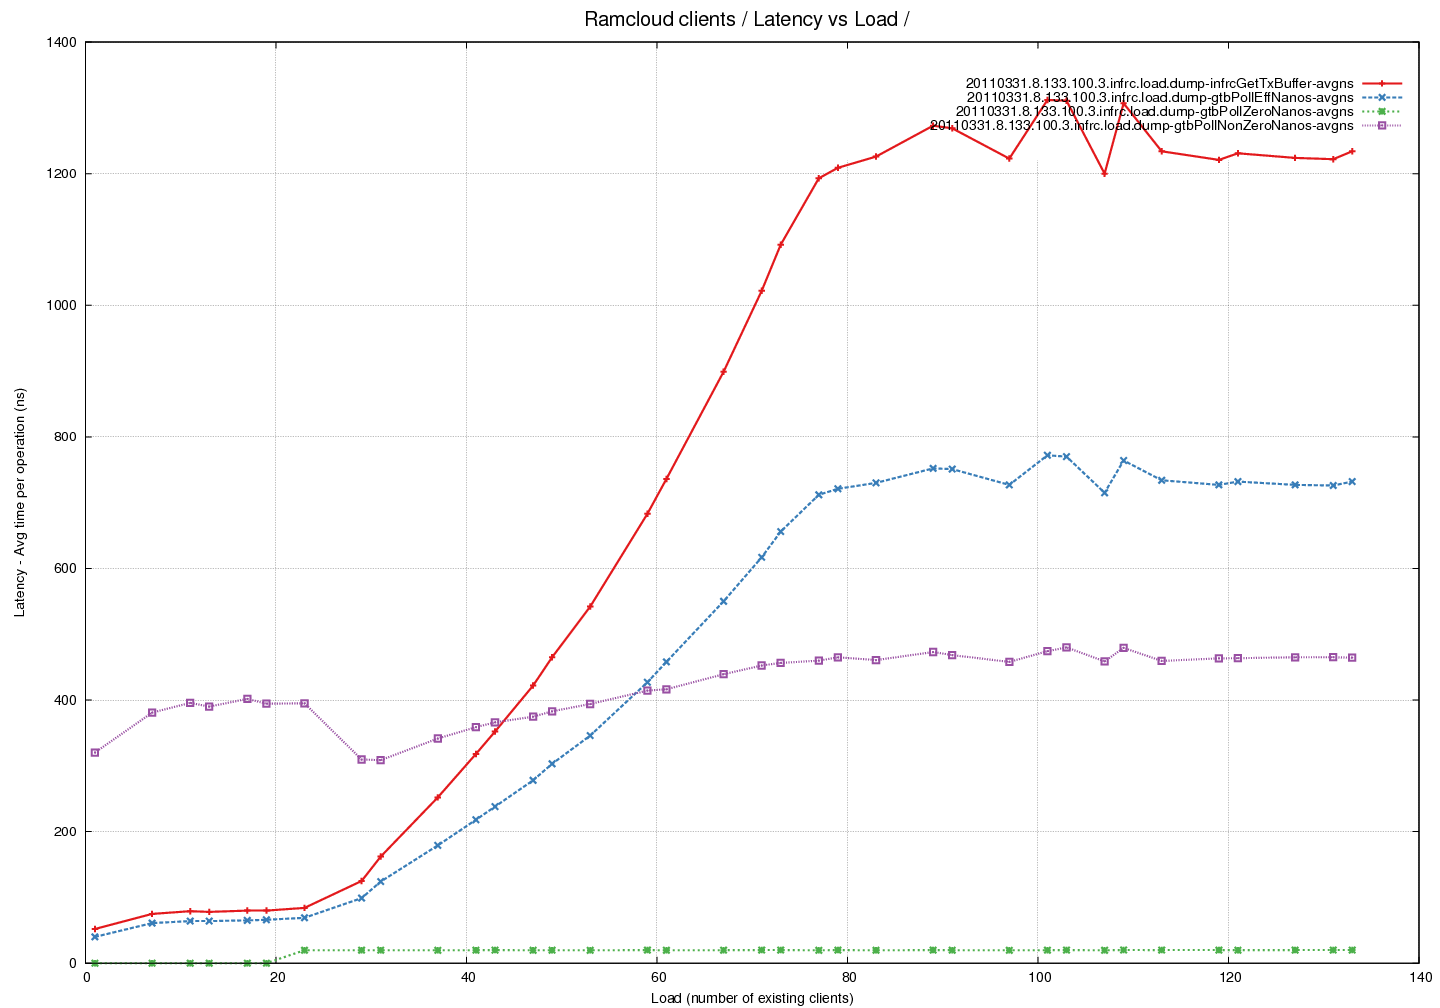
Latency Graph - Time spent in pollCQ per read (average) - fixed pool of buffers - comparing time taken by successful calls against calls that return 0
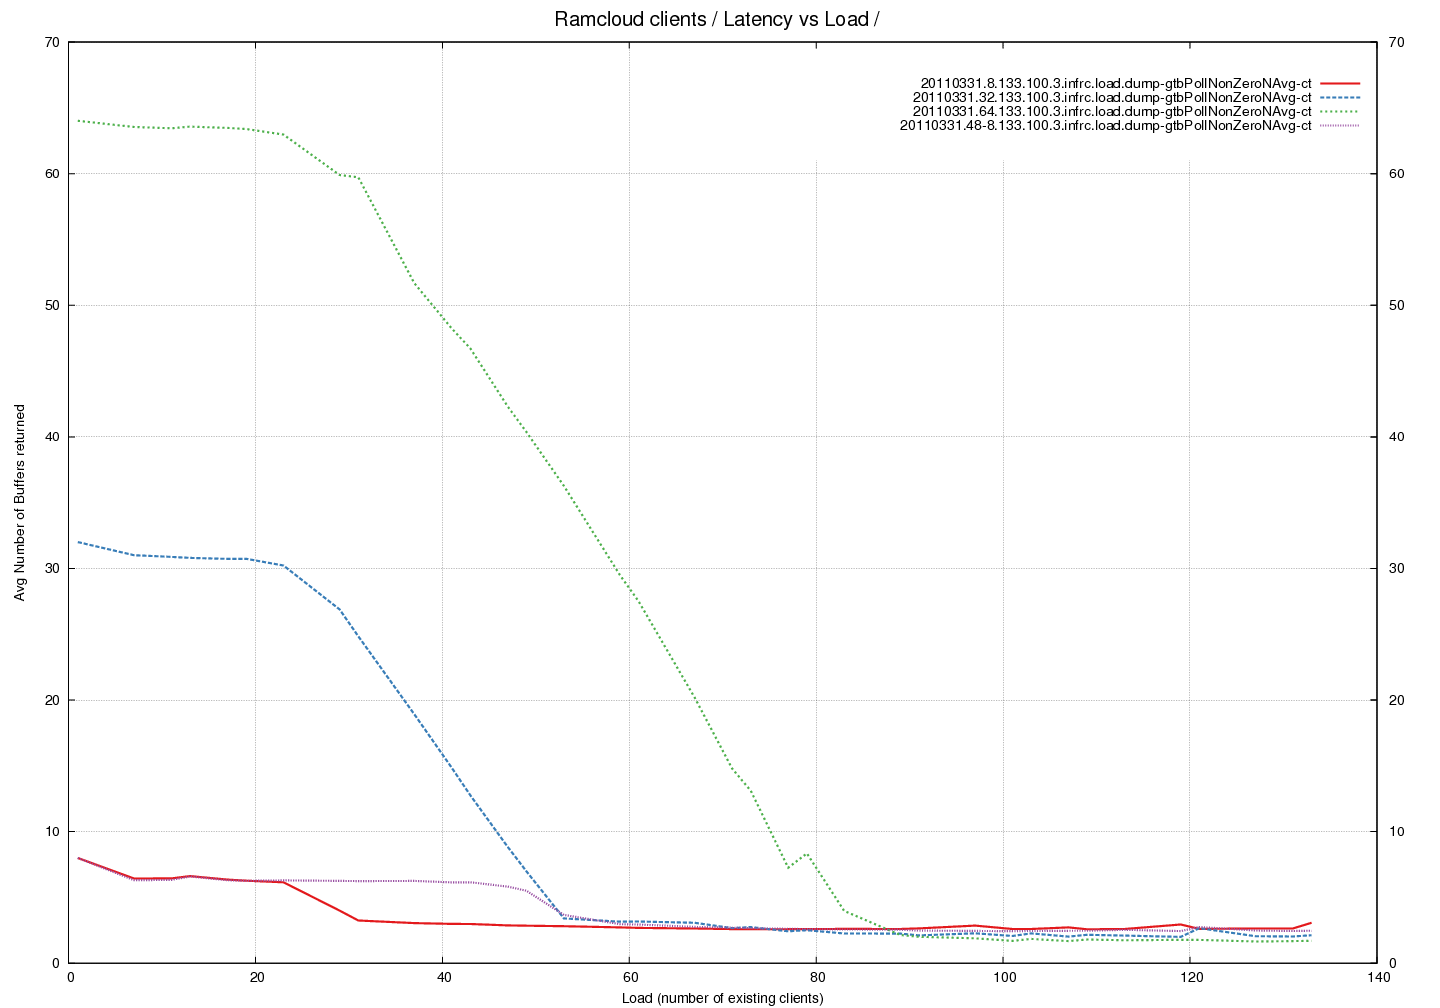
Latency Graph - Average number of buffers returned by pollCQ across different Buffer Pool sizes