...
Reference Graph - Throughput of the system for 100 byte object reads using different Transmit Buffer Pool sizes
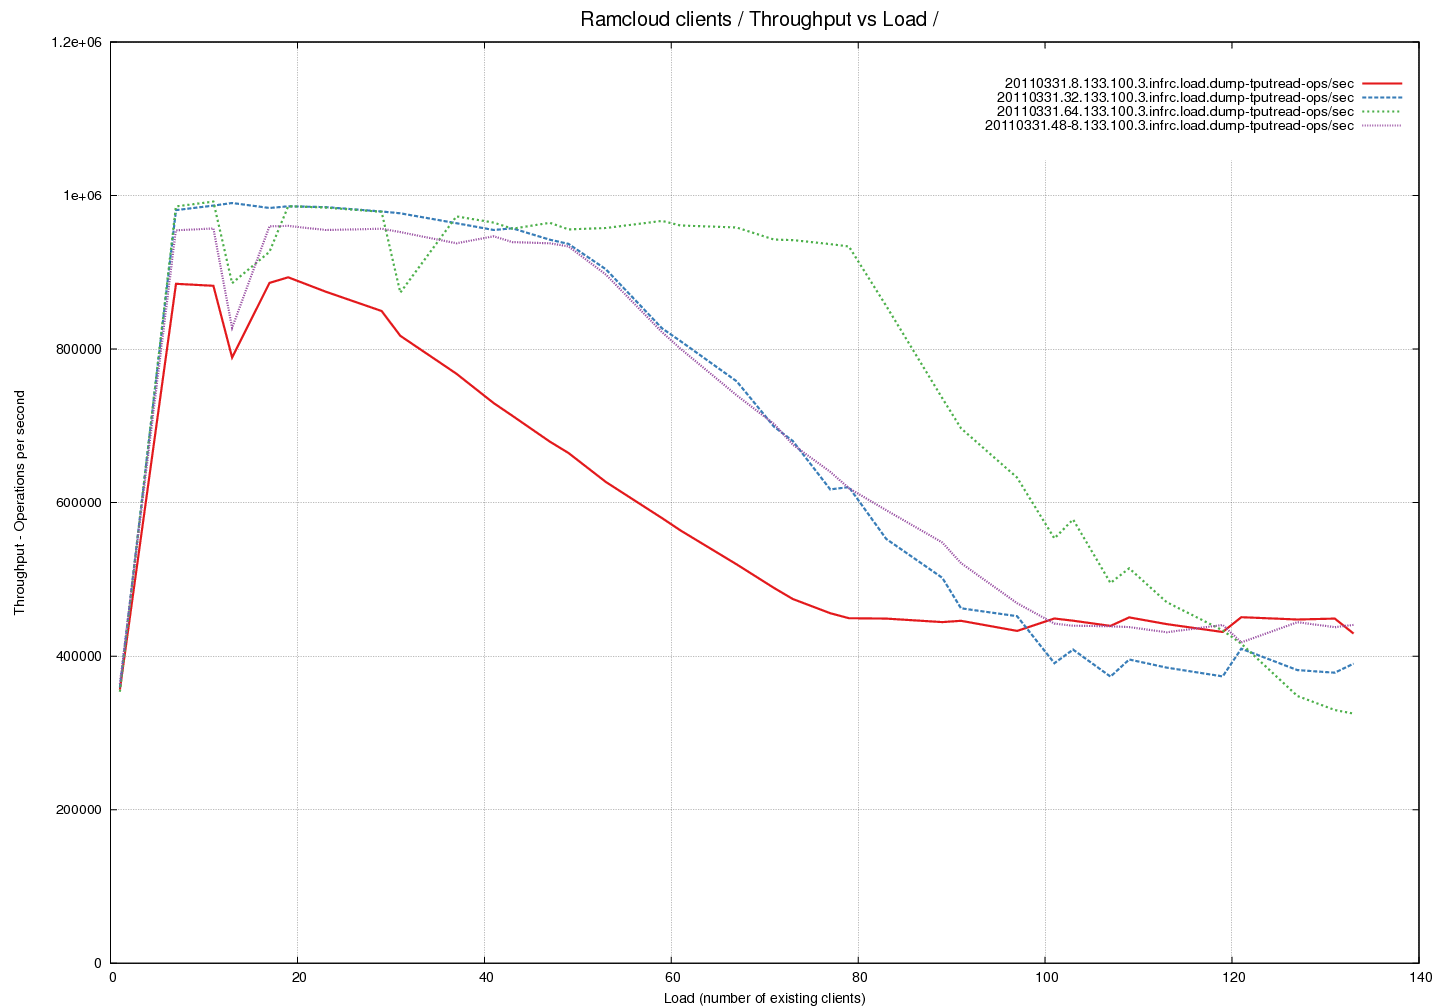
Analysis of throghput curves.
- The throughput of the system is measured here against increasing load. The load is in terms of read operations on 100 byte objects.
- We notice that the throughput of the system drops by a factor of 2 for high loads. This is observed even though we are nowhere near the network limits at this point. The measured outgoing throughput is 390217 ops/sec or 39M bytes/sec or 310M bits/sec which is well under the expected 32Gbps limit.
- The red, blue and green lines were measured with 24 RX buffers and 8, 32 and 64 TX buffers respectively.
- The violet line was measured with 48 RX buffers and 8 TX buffers. Notice that adding buffers to the pool on the receive side allows the trasmit side to see a higher throughput - this is not expected.
Latency Graph - Time spent in pollCQ per read (average) across different Transmit Buffer Pool sizes
...