Goal
Measure and understand the performance of Infiniband under load.
Parameters of the experiments
Results/Graphs
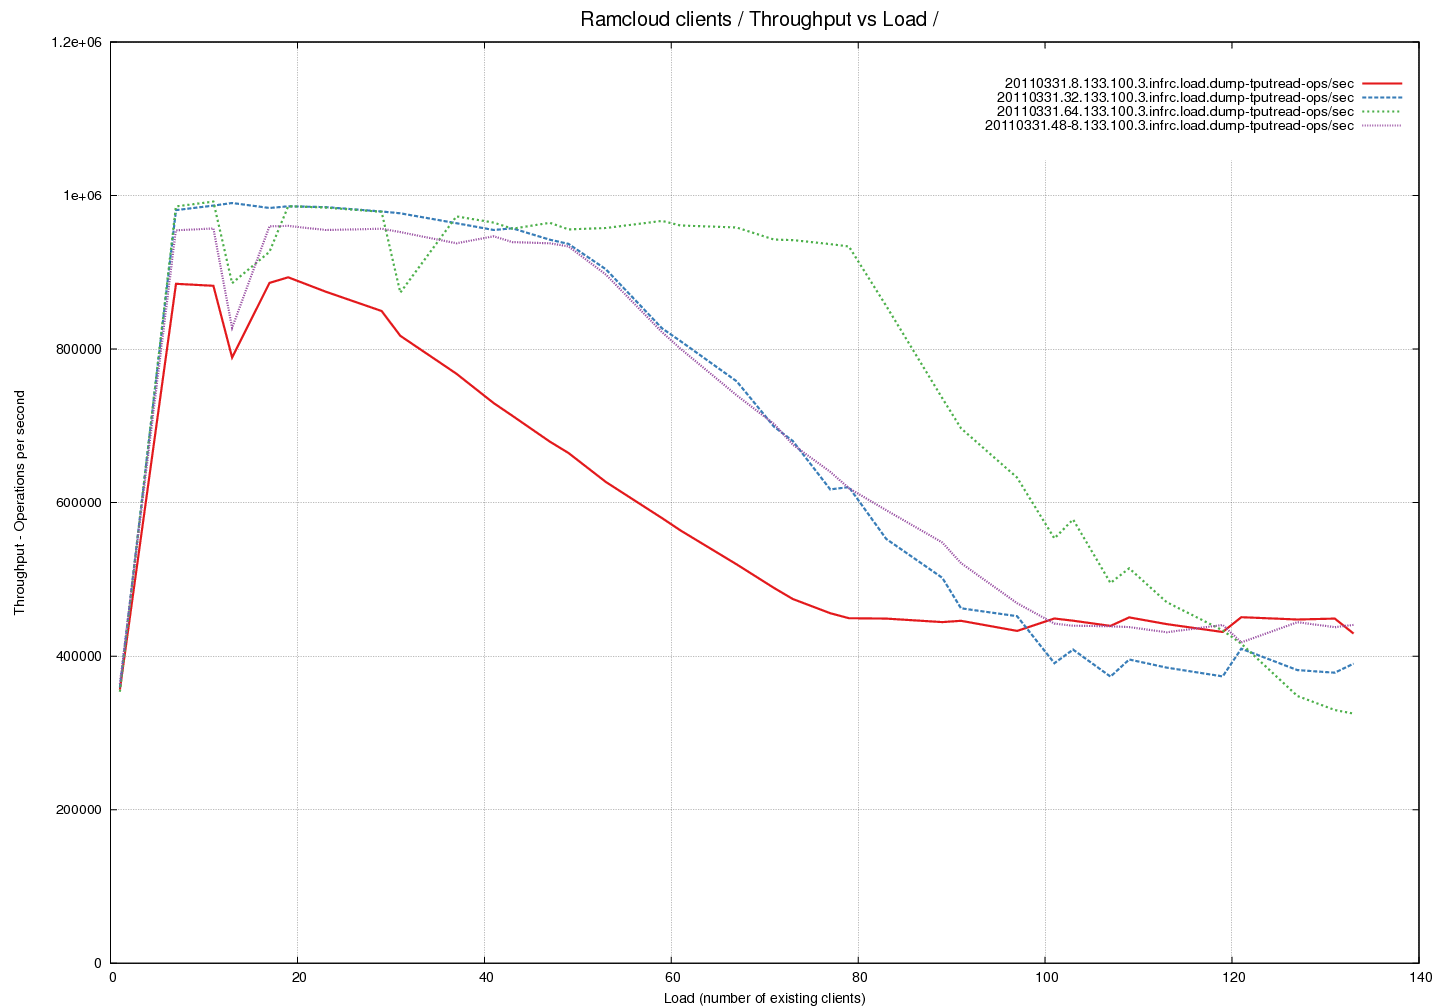
Reference Graph - Throughput of the system for 100 byte object reads using different Transmit Buffer Pool sizes
Analysis
- The throughput of the system is measured here against increasing load. The load is in terms of read operations on 100 byte objects.
- We notice that the throughput of the system drops by a factor of 2 for high loads. This is observed even though we are nowhere near the network limits at this point. The measured outgoing throughput is 390217 ops/sec or 39M bytes/sec or 310M bits/sec which is well under the expected 32Gbps limit.
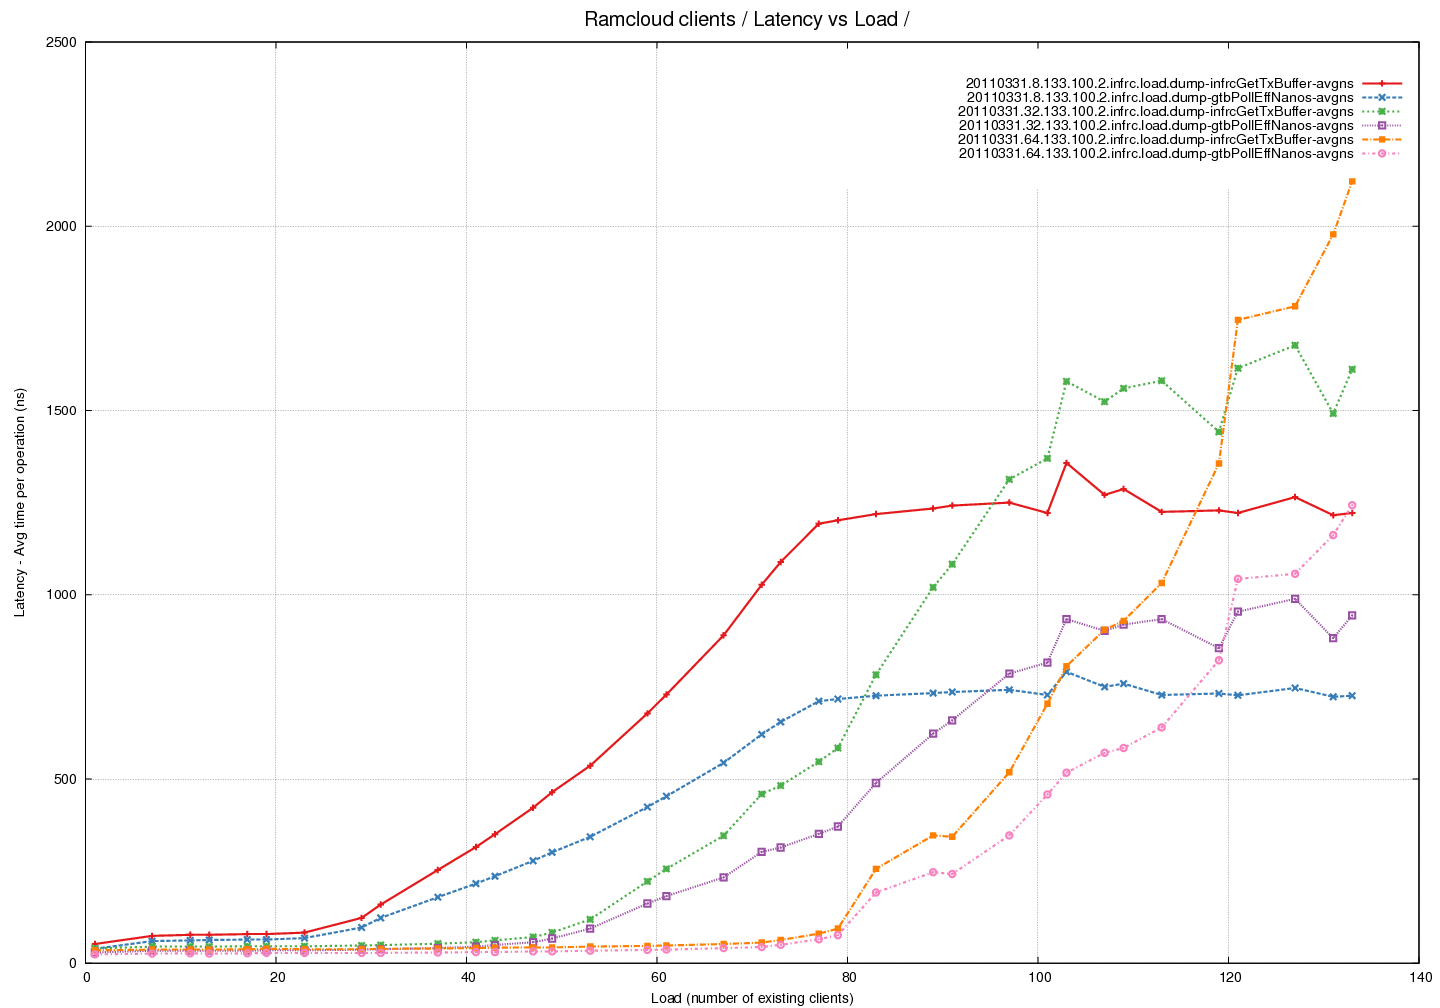
Latency Graph - Time spent in pollCQ per read (average) across different Transmit Buffer Pool sizes
- Total time spent in pollCQ was tracked and then divided by the number of read calls to calculate the average.
- This tracks the curve of time spent within the getTransmitBuffer call well. The difference between the two needs to be explained.
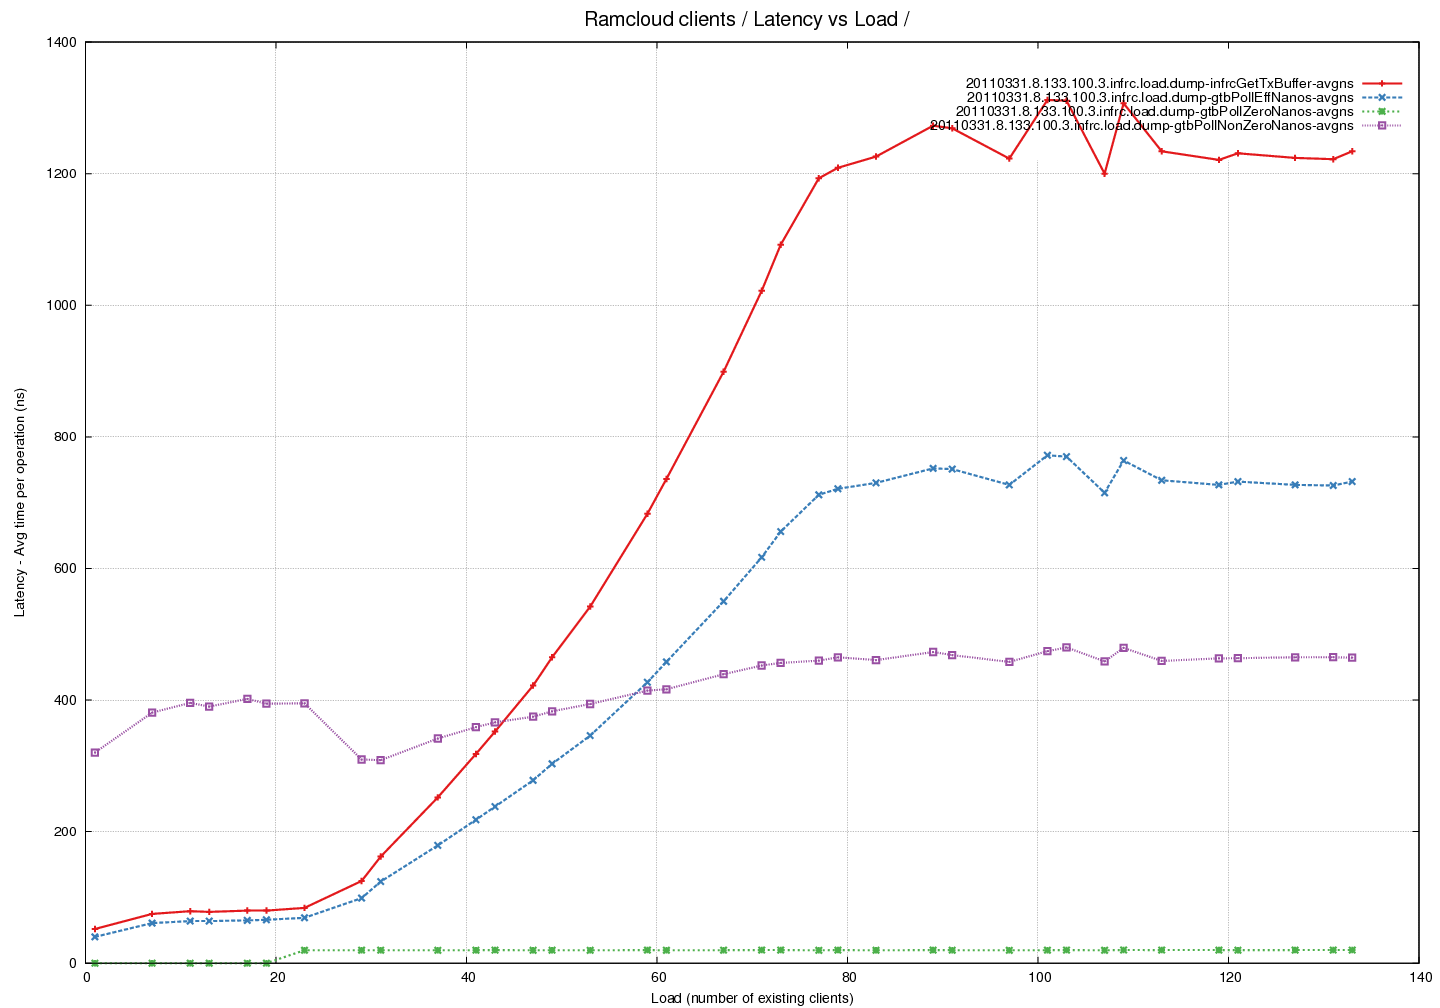
Latency Graph - Time spent in pollCQ per read (average) - fixed pool of buffers - comparing time taken by successful calls against calls that return 0
- Note that time taken per successful call is increasing with load. Number of calls also increases with load => multiplicative effect.
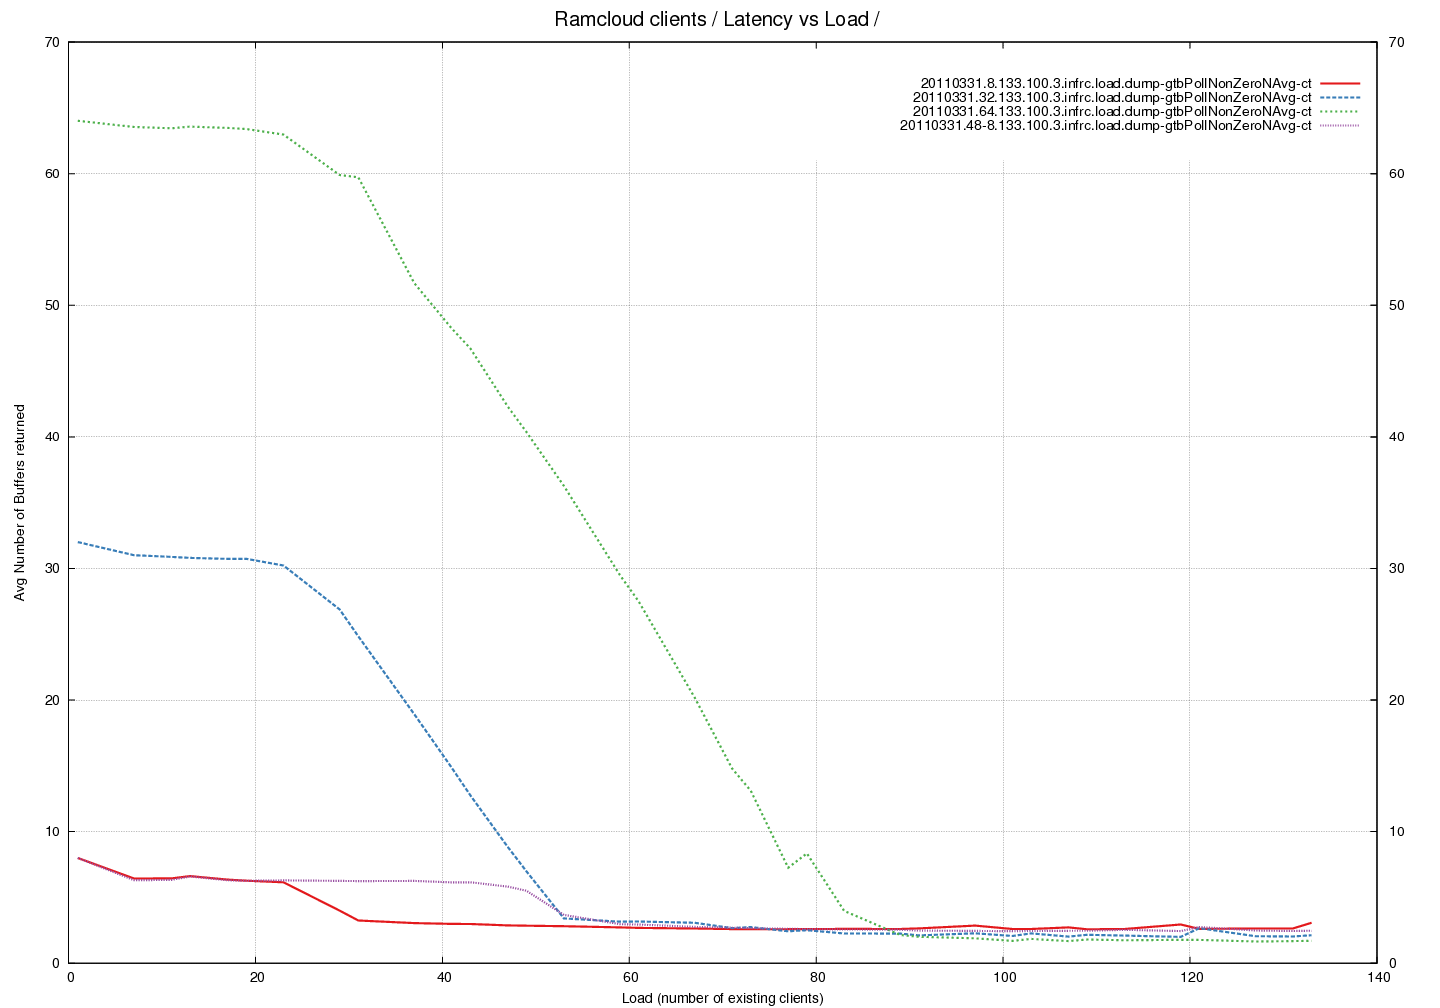
Latency Graph - Average number of buffers returned by pollCQ across different Buffer Pool sizes
- An interesting trend here that is independent of number of buffers in the pool. There is a drop in the average at the same load irrespective of buffer-pool.