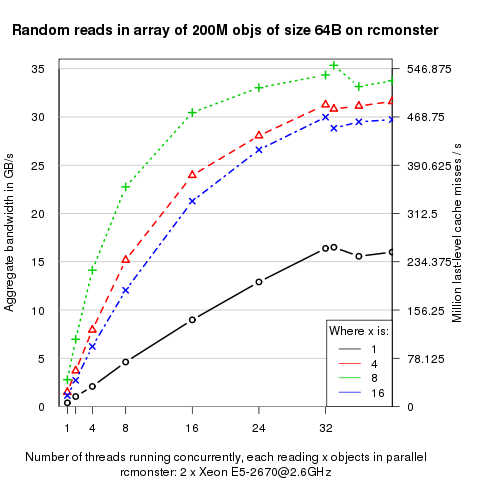
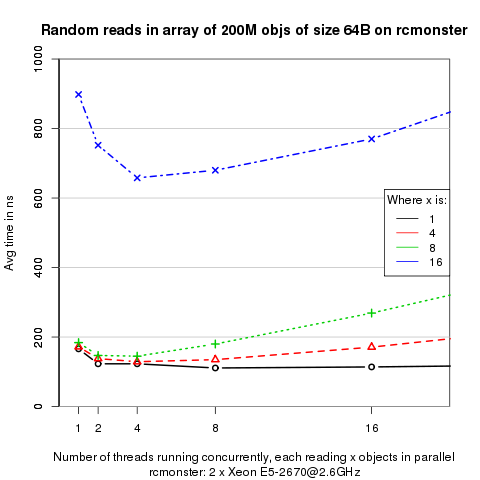
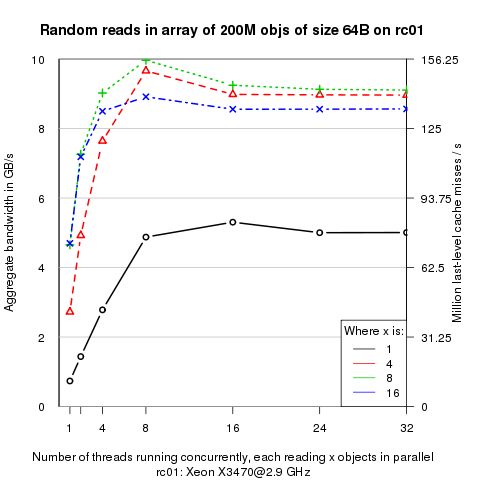
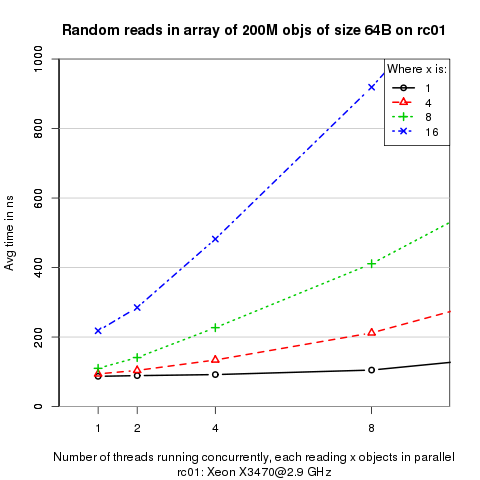
Here are the graphs from the experiments.
First and third show the bandwidth in GB/s as well as number of last level cache misses / s as we vary the number of objects being read in parallel by a thread and the number of threads for rc01 and rcmonster machines respectively.
Second and fourth show the avg time in ns for reading a varying number of objects in parallel as we vary the same parameters as above on rc01 and rcmonster respectively.


