ZooKeeper Performance
Setup
- All machines were dual-core Xeon 3060 machines
- All machines were hooked up to a single gigabit switch
- ZooKeeper 3.3.0 was used for both the clients and servers
- 3 machines made up the ZooKeeper cluster
- The benchmark utility is a Java client that will connect to a specific ZooKeeper server (always the same) and do n back-to-back reads or writes of a single object of a given length
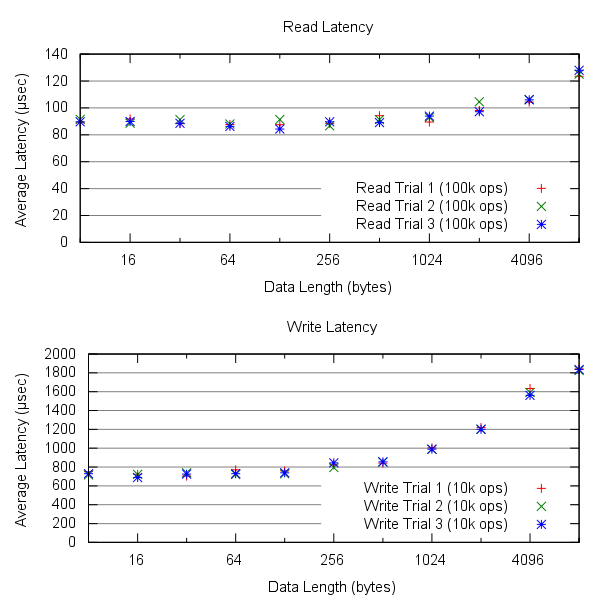
Latency with benchmark client running on the ZooKeeper server
Observations during reads:
- ZooKeeper takes about 20-25% of one core
- The benchmark client uses about 10% of the other
- The kernel uses about 20-25% of each core
- The userspace programs spend most of their time waiting on a futex.
- The replicas are idle.
Observations during writes
- ZooKeeper takes about 50% of the CPU
- The kernel uses about 7% of the CPU
- The first replica uses about 60-80% of its CPU on ZooKeeper and about 12% on the kernel
- The second replica uses about 40-60% of its CPU on ZooKeeper and about 12% on the kernel
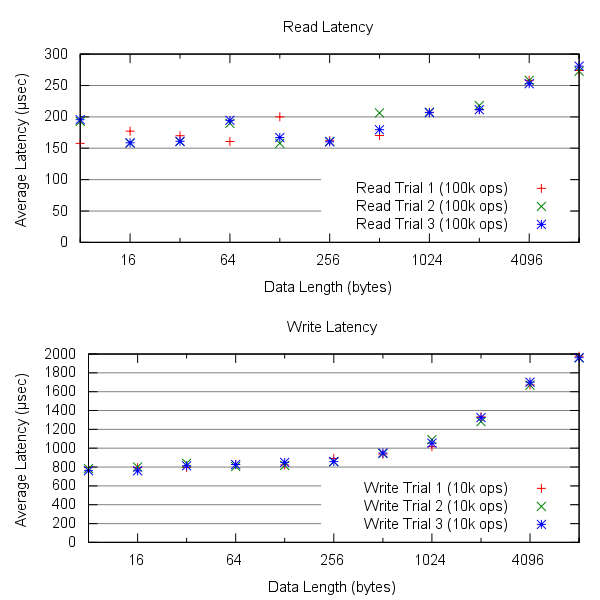
Latency with benchmark client running on a separate machine
Throughput
The maximum read throughput I was able to observe was ~50,000 512Byte-read operations per second. This was using 8 processes (without my own Java threads) on each of 4 client machines. This does not entirely saturate the cores on the server – they are each between 5% and 30% idle at any given time.
The maximum read throughput I was able to observe from a single client machine was only ~29K 512Byte-read operations per second using 8 processes (each of 4 Java threads). I don't understand the behavior of the client library (which seems to spawn about 11 threads of its own), so I can't really explain this.
1 client machine: 5.6Kops/s (512 byte reads)
2 client machines: 10.4Kops/s (512 byte reads)
3 client machies: 15.7Kops/s (512 byte reads)
4 client machines: 20.0Kops/s (512 byte reads)

